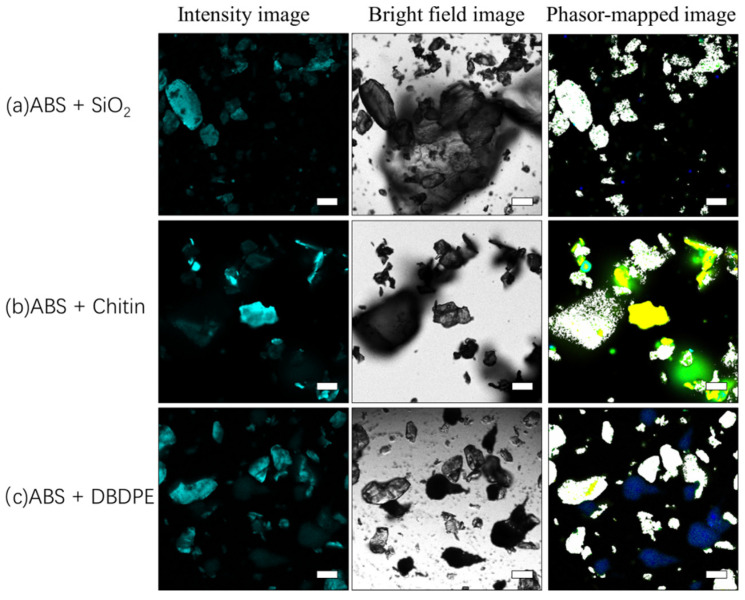
Figure 11.
Identification of microplastics in a single interfering substance. (a) Fluorescence intensity image, bright field image, and fluorescence lifetime map of the phasor cluster area map of the mixture of ABS and SiO2; (b) fluorescence intensity image, bright field image, and fluorescence lifetime map of the phasor cluster area map of the mixture of ABS and chitin; (c) fluorescence intensity image, bright field image, and fluorescence lifetime map of the phasor cluster area map of the mixture of ABS and DBDPE. ABS was marked with white. The scale bar indicates 50 µm.

