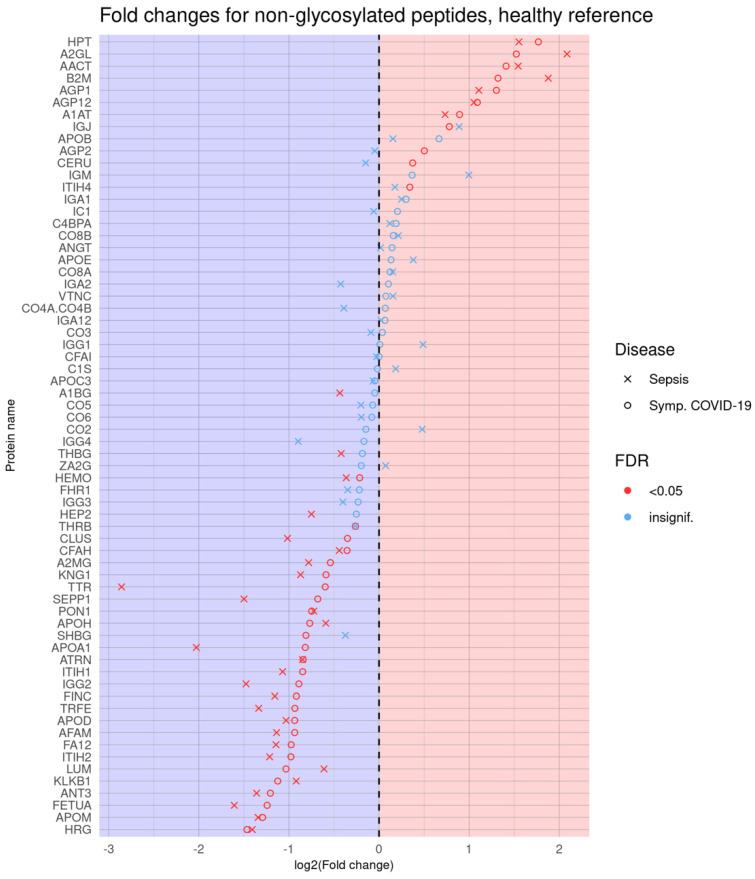
Figure 9.
Dot plot showing log-transformed fold changes for each nonglycosylated peptide, using healthy controls as the reference against the sepsis and symptomatic COVID-19 (by which this is sorted) phenotype groups, each indicated using its own symbol. Red symbols represent those that are statistically significant at FDR < 0.05.

