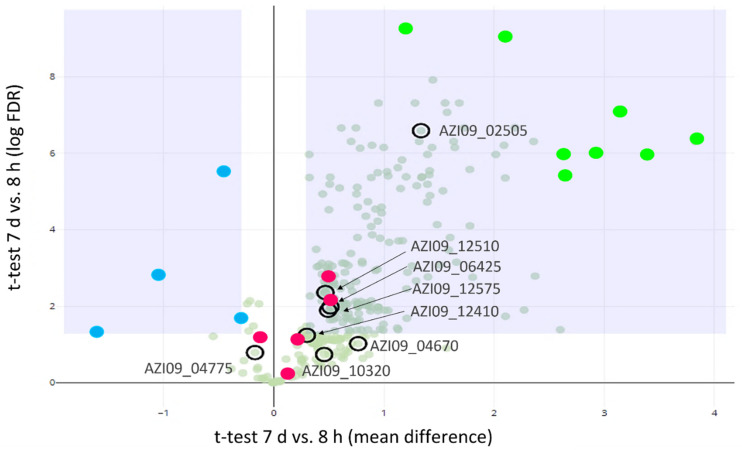
Figure 3.
Proteomics analysis of secreted proteins. Volcano plot for the differential abundance analysis of 8 h vs. 7 d secretomes: GHs and GTs (encircled), proteins with higher abundance at 8 h (blue dots), proteins with higher abundance at 7 days (light green dots), and potential moonlighting proteins (red dots).

