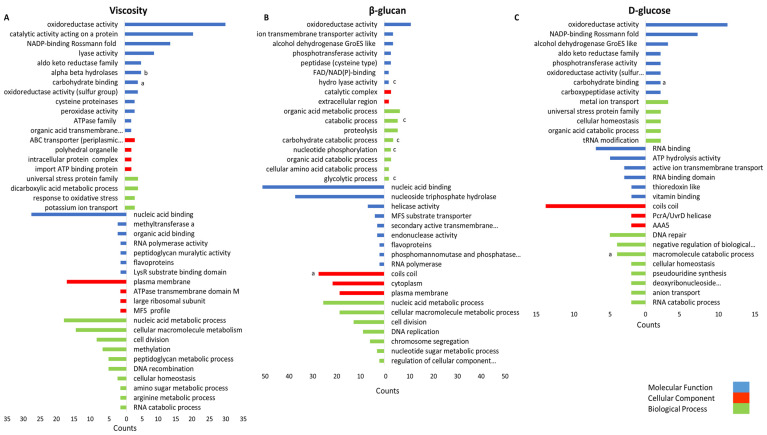
Figure 7.
Gene set overrepresentation analysis of proteins correlating with (A) viscosity, (B) β-glucan content, and (C) D-glucose content. Top bar charts indicated the positively and bottom bar chart the negatively correlating proteins with corresponding GO terms (y-axis). The x-axis represents the gene counts. GO terms comprising proteins of interest are indicated by (a) GHs and GTs; (b) β-glucan-biosynthesis-associated proteins (other than GHs and GTs), and (c) moonlighting-associated protein enolase (AZI09_08765).

