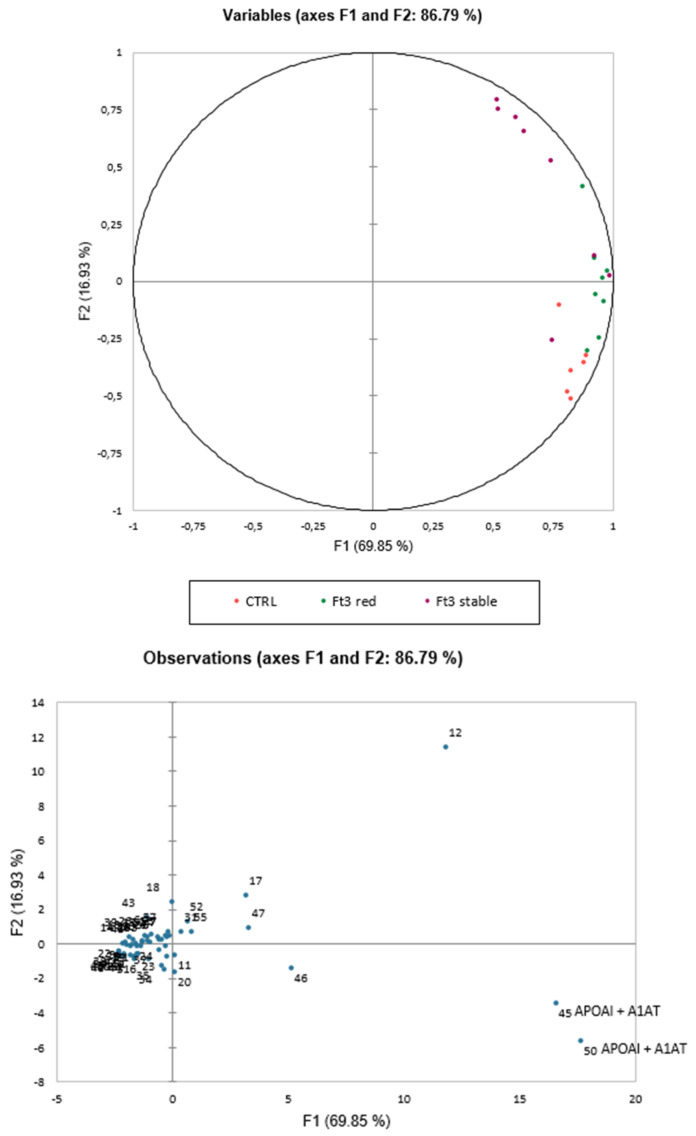
Figure 2.
Principal component analysis (PCA) showed the 57 differential abundant spots (DASs) and summarized the 86.79% (PC1:69.85% and PC2:16.93%) of the variance and the three groups clustered alongside the second component. The image also reports the histogram with the contributions of each significant variant in the first two principal components (PCs), highlighting spots 45 and 50, identified as APOAI and fragments of A1AT, as the most significant.

