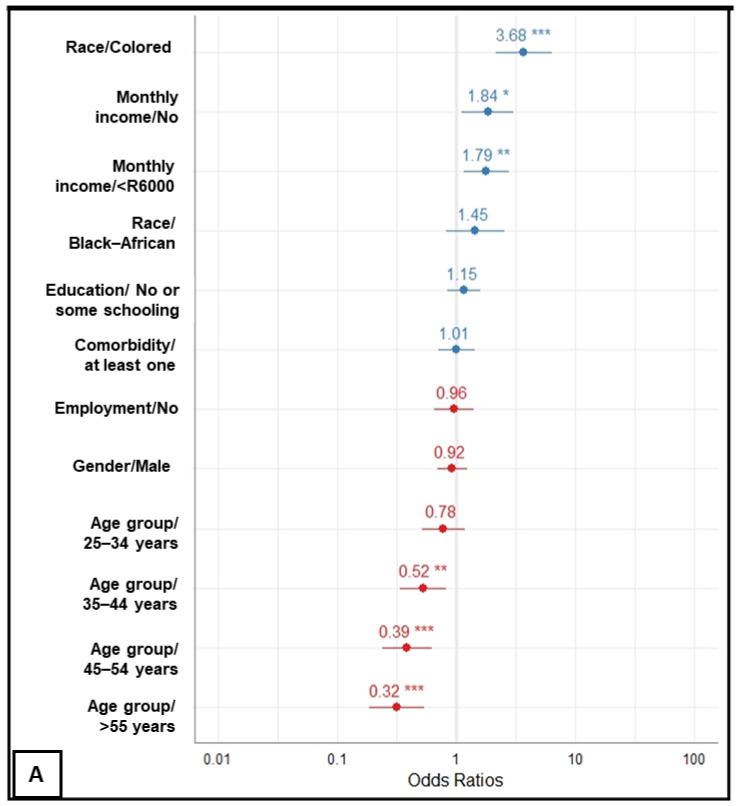
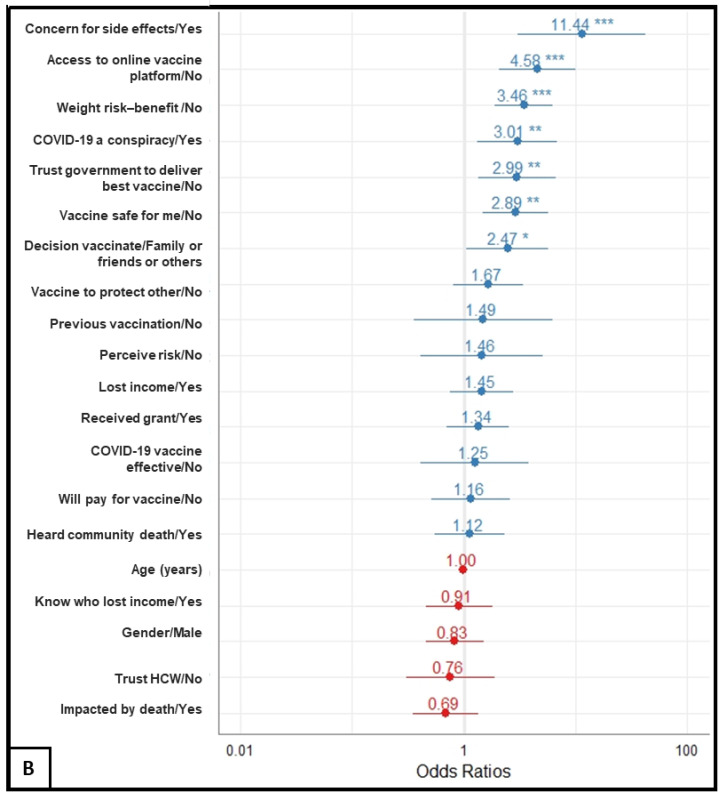
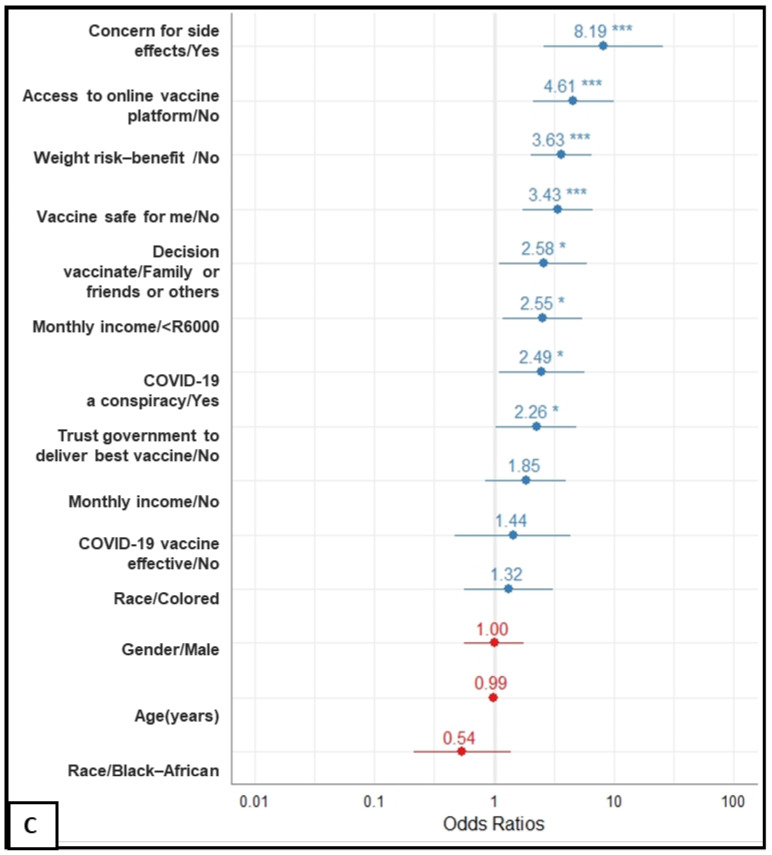
Figure 2.
Forest plots displaying factors associated with vaccine hesitance among respondents from four local communities in South Africa, from 6 June to 30 June 2021. Plots (A–C) indicate models adjusted for sociodemographic factors, COVID-19 related factors and combination of (A,B), respectively. Of note, all models are adjusted for gender (binary) and for age (continuous). The vertical line, slightly thicker than the other grid lines (x-axis position 1) indicates the neutral line, i.e., the vertical intercept that indicates no effect. Points in the plots and related horizontal lines represent the estimated odds ratio and their corresponding 95% confidence interval (CI) of COVID-19 vaccine hesitancy defined as uncertainty or intention to refuse COVID-19 vaccination, respectively. Blue and red colors indicate odds of hesitancy and of acceptance respectively. Asterisks indicate the significance level of the p-values (*: p < 0.05, **: p < 0.01, ***: p < 0.001). Exact 95% CI and p-values are provided in Table 2.


