Figure 5:

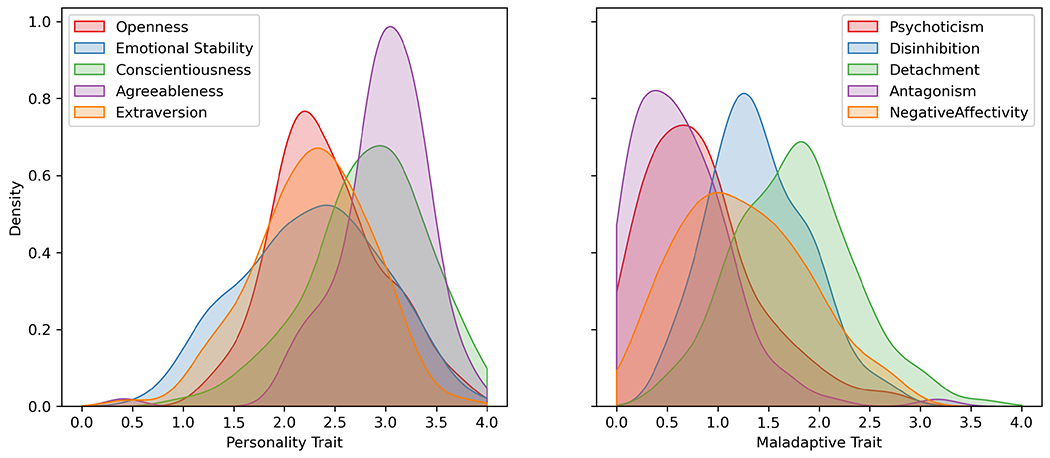
Density plot displays the distribution of the adaptive and maladaptive values of all participants. Each adaptive and maladaptive trait ranges from 0 to 4.

Density plot displays the distribution of the adaptive and maladaptive values of all participants. Each adaptive and maladaptive trait ranges from 0 to 4.