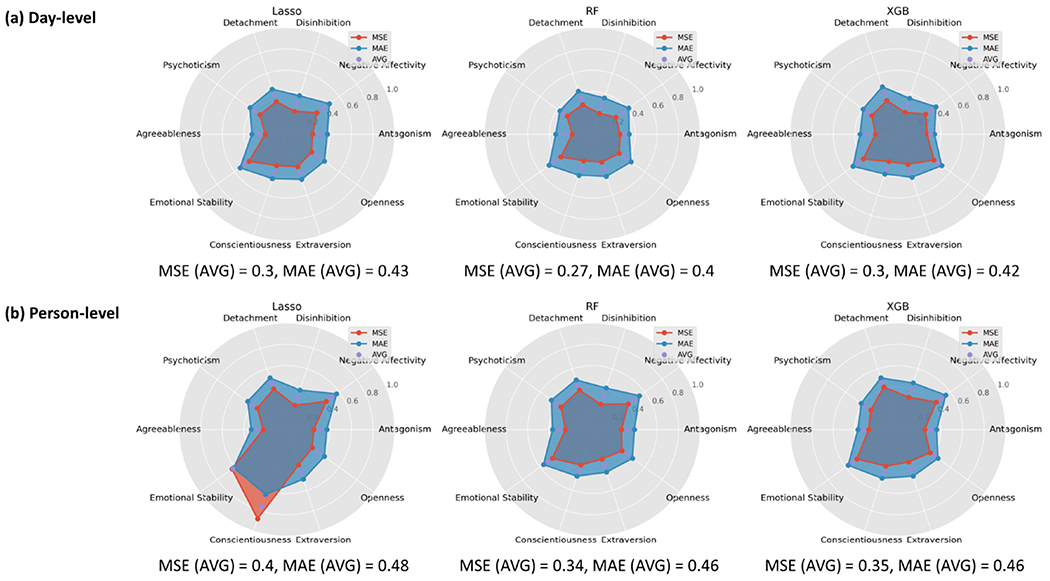
Figure 7:

The radar plots visualize the MSE and MAE of three machine learning models (Lasso, RF, and XGB) when predicting each adaptive and maladaptive trait. The top row shows the results using day-level features, and the bottom row shows the results using the person-level features. AVG is the average of MSE and MAE per trait. MSE (AVG) is the average MSE across all traits, and MAE (AVG) is the average MAE across all traits.
