Figure 5.
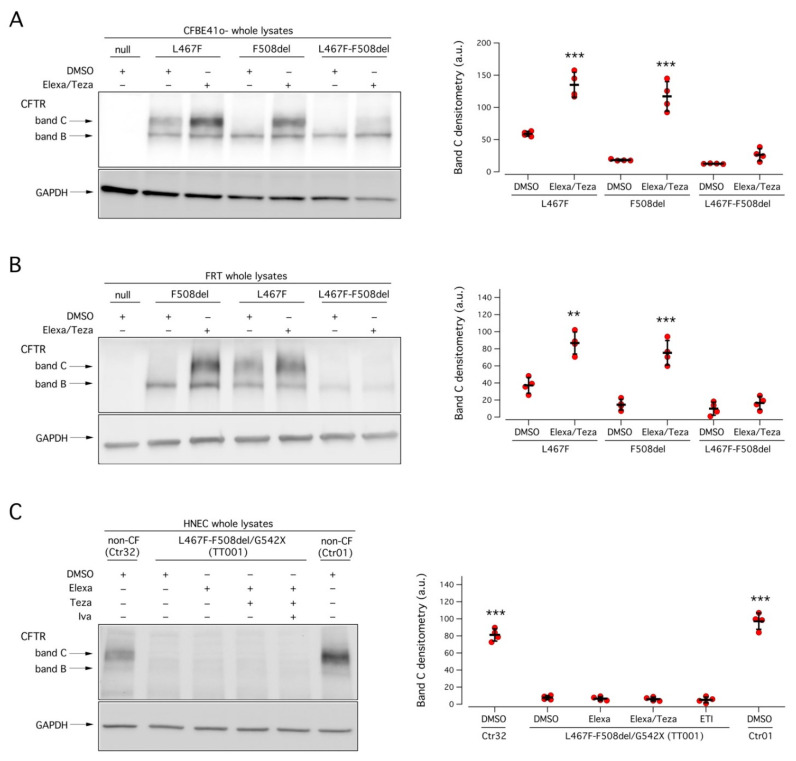
Biochemical analysis of the L467F-F508del CFTR complex allele expression pattern. (A,B) Left panels: representative Western blot images showing the electrophoretic mobility of L467F-F508del-CFTR and, for comparison, of F508del- and L467F-CFTR transiently expressed in CFBE41o− (A) or FRT (B), treated for 24 h with DMSO alone (vehicle), or Elexa/Teza (3 µM/10 µM). Arrows indicate the complex-glycosylated (band C) and core-glycosylated (band B) forms of the CFTR protein. Right panels: CFTR band (C) densitometry of the Western blot experiments. Asterisks indicate statistical significance of the treatments vs. their respective control (DMSO-treated): ** p < 0.01; *** p < 0.001. (C) Left panel: representative Western blot image showing CFTR electrophoretic mobility in lysates of nasal epithelia derived from patient TT001, and, for comparison, from two non-CF donors (ID: Ctr01 and Ctr32). Epithelia were treated for 24 h with vehicle alone (DMSO) or Elexa (3 µM), or Elexa/Teza (3 µM/10 µM) or ETI (3 µM/10 µM/5 µM) prior to lysis. Right panel: CFTR band C densitometry of the Western blot experiments. Asterisks indicate the statistical significance of the treatments vs. DMSO-treated TT001: ** p < 0.01; *** p < 0.001.

