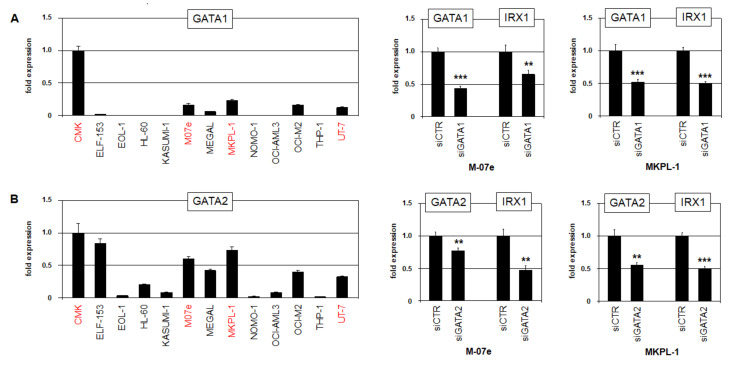
Figure 4.
Transcriptional regulation of IRX1. Expression analysis of (A) GATA1 and (B) GATA2 by RQ-PCR in selected AML cell lines (left). Transcript levels are indicated in relation to CMK. Cell lines expressing significant levels of IRX1 are highlighted in red. SiRNA-mediated knockdown of (A) GATA1 and (B) GATA2 demonstrates activations of IRX1 and IRX5 in AML cell lines M-07e and MKPL-1 (right). p-values are indicated by asterisks (** p < 0.01, *** p < 0.001).

