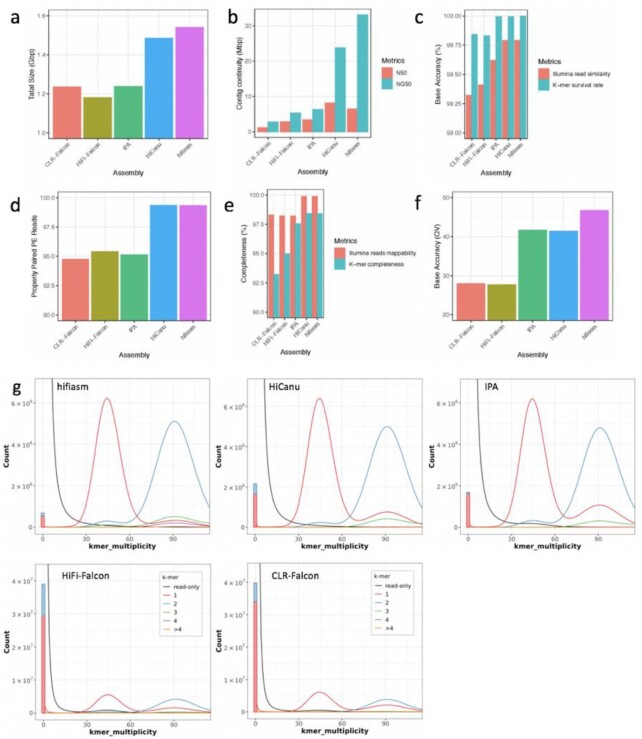
Figure 1:
Benchmarking analysis of cassava TME204 assemblies from PacBio CLRs and HiFi reads. (a) Assembly size of all resolved alleles. (b) Contig continuity measured as N50 and NG50. N50 is the length of the shortest contig in the set of largest contigs that make up 50% of the assembly size as shown in (a). NG50 is the length of the shortest contig in the set of largest contigs that make up 50% of the haploid genome size of 750 Mb. (c) Base accuracy of contigs, measured by sequence similarity between contigs and mapped Illumina reads, and as the fraction of k-mers found in both contigs and the Illumina reads. (d) Structure accuracy of contigs, measured by the percentage of properly paired Illumina PE reads. (e) Assembly completeness, measured by the percentage of mapped Illumina reads and the fraction of reliable Illumina k-mers retained in the contigs. (f) Phred scale quality value (QV) of contigs, calculated using the error probability P with the formula: QV = −10 * log(P, 10), where P is the fraction of k-mers found in the contigs but missing in the Illumina reads. (g) Completeness of resolved haplotypes measured by Merqury copy number spectrum plots. The x-axis shows k-mer multiplicity computed from the Illumina reads. The y-axis shows the abundance for k-mers with a given multiplicity, either in the Illumina reads (black) or in the contigs (colored by the number of times they are found in the underlying assembly). Red peaks at 45× represent resolved haplotype alleles, red peaks at 90× collapsed haplotype alleles. Black humps found at either 40× (heterozygotes/1-copy k-mers) or 80× (homozygotes/2-copy k-mers) represent reliable Illumina k-mers missing in contigs, corresponding to the assembly completeness in (e). Assembly-specific k-mers absent from the Illumina reads are plotted as a bar at zero k-mer multiplicity, corresponding to the error probability in (f).

