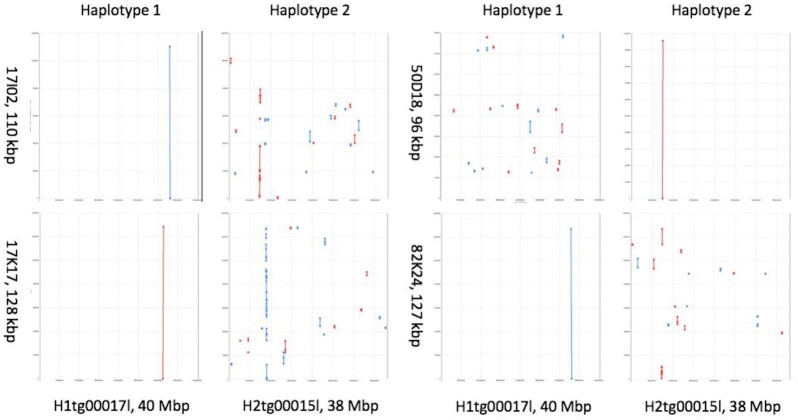
Figure 3:
Phasing accuracy of cassava TME204 haplotigs validated by BAC-to-haplotig alignments. Each dot plot shows the alignment of 1 BAC (y-axis) with 1 haplotig (x-axis). Forward alignments are plotted as red lines/dots, reverse alignments in blue. A line represents an undisturbed segment of alignment. When a region is correctly assembled and phased, the corresponding BAC sequence will align continuously (a resolved BAC). Three of the 4 BACs were resolved in the TME204 H1 assembly, and 1 (50D18) was resolved in the TME204 H2 assembly. For each BAC, the striking differences of BAC-to-haplotig alignments between haplotypes reveal the high level of haplotype differences in these regions.

