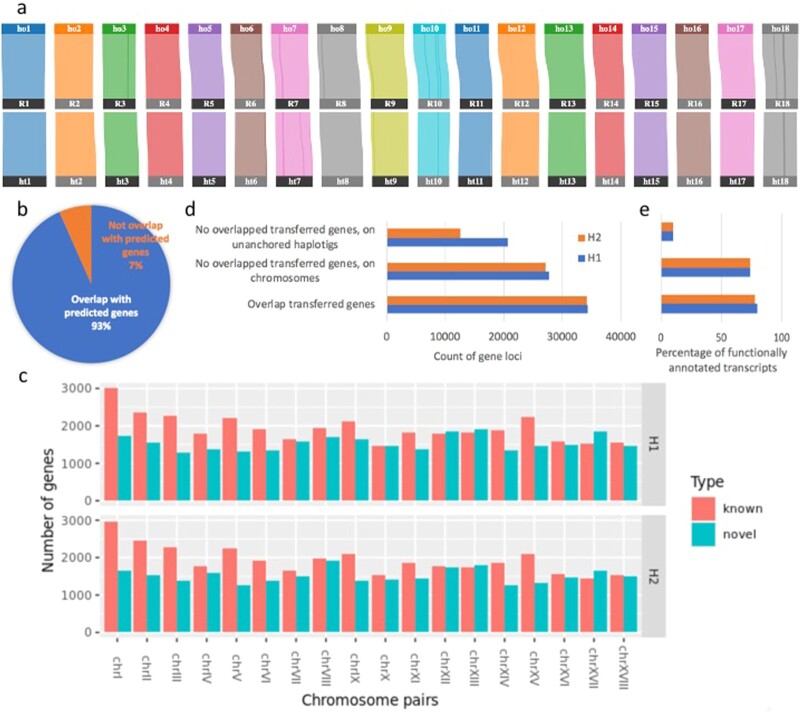
Figure 5:
Cassava TME204 genome annotation. (a) Gene synteny (99%) between AM560 and the TME204 pseudochromosome pairs revealed by orthologous pairs of transferred reference genes. “ho” and “ht” encode “haplotype one” and “haplotype two” of TME204, respectively. “R” encodes “reference.” Color lines highlight the inverted regions. (b) Recall rate (93%) of the transferred reference genes by ab initio gene prediction in the TME204 H1 assembly. For the TME204 H2 assembly the recall rate is 94%. (c) Distribution of ab initio predicted gene loci among TME204 chromosome pairs. “known” represents predicted gene loci overlapped with transferred reference gene models. “novel” represents predicted gene loci without any overlapping transferred reference gene models. (d) Amount of novel predicted gene loci on unanchored haplotigs in comparison to that of chromosomal gene loci in TME204 assemblies. In comparison to the H1 assembly, the H2 assembly has less unanchored haplotigs (60 Mb instead of 100 Mb, Table 2). As a result, the number of novel predicted gene loci from these sequences is also lower. (e) Fractions of functionally annotated transcripts, which are grouped similarly as predicted gene loci, as described in c and colored in d. Bubble plots of enriched cellular component (CC) terms in novel chromosomal genes (f) and novel genes from unanchored haplotigs (g). The colors of the bubbles are illustrated from blue to red in descending order of –log10 (P-value). The sizes of the bubbles are from small to large in ascending order of total gene counts annotated with the CC terms shown on the y-axis. The x-axis represents the ratio of novel/total gene counts. Results shown are from the TME204 H1 assembly. The enriched CC terms in the TME204 H2 assembly are almost identical (Supplementary Fig. S7c and d).

