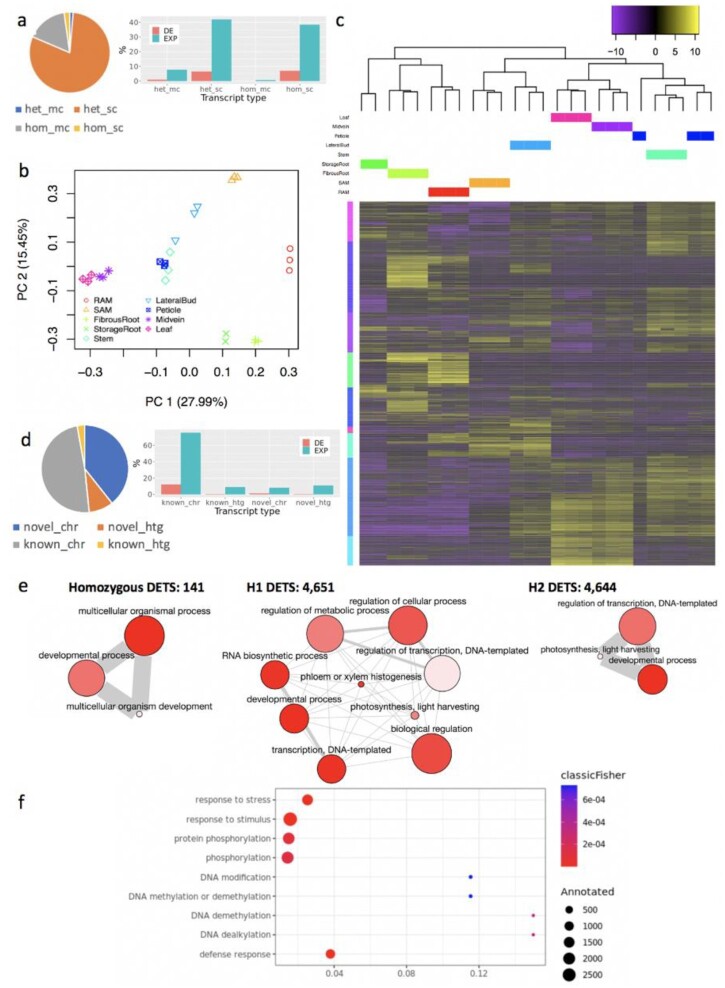
Figure 6:
Haplotype-resolved analysis of differentially expressed transcripts during cassava TME204 tissue development. (a) Clustering analysis of transcripts from both TME204 H1 and H2 assemblies. “hom” encodes transcripts with identical sequences between haplotypes. “het” encodes transcripts with different sequences between haplotypes. “mc” represents multi-copy transcripts within 1 haplotype assembly. “sc” represents single-copy transcripts in 1 haplotype assembly. Identical transcripts (“hom” and “mc”) are collapsed and present only once in the haplotype-resolved reference transcriptome. Multi-copy (“het_mc” and “hom_mc”) transcripts are less highly expressed (“EXP”) and differentially regulated (“DE,” adjusted P < 0.00001 and a fold change of log2|FC| >2) during TME204 tissue development. (b) Principal component analysis (PCA) of samples based on transcript expression levels. (c) Sample and transcript clustering analysis of the 9,436 differentially expressed transcripts (DETs) across the 9 tissues (adjusted P < 0.00001 and log2|FC| >2). The color scale represents row-centered expression levels. (d) Transcripts from chromosomal, novel predicted gene loci are also less highly expressed (”EXP”) and differentially regulated (“DE,” adjusted P < 0.00001 and a log2|FC| >2) in different TME204 tissues. (e) ReviGo graphs of enriched biological process (BP) terms in DETs with different haplotype origins: homozygous DETs common to both H1 and H2, DETs from the H1 assembly, and DETs from H2 assembly. Each GO term is a node. Related GO terms are connected by edges between the nodes. Node color indicates the Fisher exact test P-value. The lighter the color, the lower the P-value. Node size corresponds to the frequency of the GO term in the whole UniProt database. (f) Bubble plot of enriched BP terms in the 663 chromosomal, novel predicted DETs.

