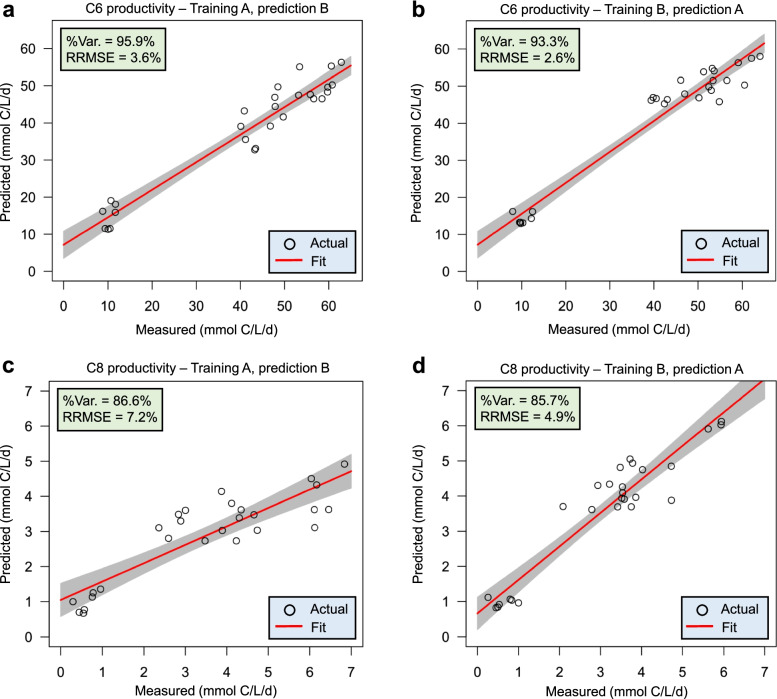
Fig. 4.
Prediction results of C6 and C8 productivities using HRT bioindicators. a, b Prediction performance of C6 productivity. c, d Prediction performance of C8 productivity. We obtained results in a and c by using relative abundance data of bioreactor A for training the model and data of bioreactor B for testing. Results using the data of bioreactor B for training and bioreactor A for testing are shown in b and d. The red lines and grey shaded areas depict the best-fit trendline and the 95% confidence interval of the least-squares regression, respectively. C6, n-caproate; C8, n-caprylate; %Var., explains the variance (%) in C6/C8 productivity of the training set; RRMSE, relative root mean square error

