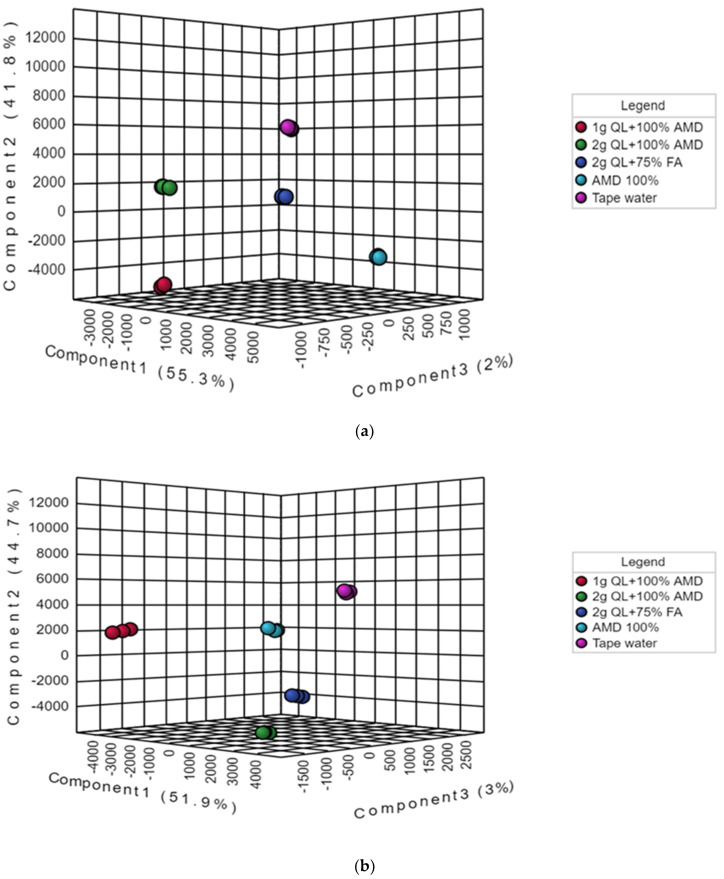
Figure 2.
Partial least squares-discriminate analysis (PLS-DA) score plots of metabolic profiles from liquid chromatography linked to mass spectrometry data of samples from Marykies (a) and Royal (b) potato tuber samples. Different colors denote different treatments: tap water (T1): purple, AMD 100% (T2): light blue, 1 g QL + 100% (T3): red, 2 g QL + 100% AMD (T4): green and 2 g QL + 75% FA (T5): dark blue, respectively.

