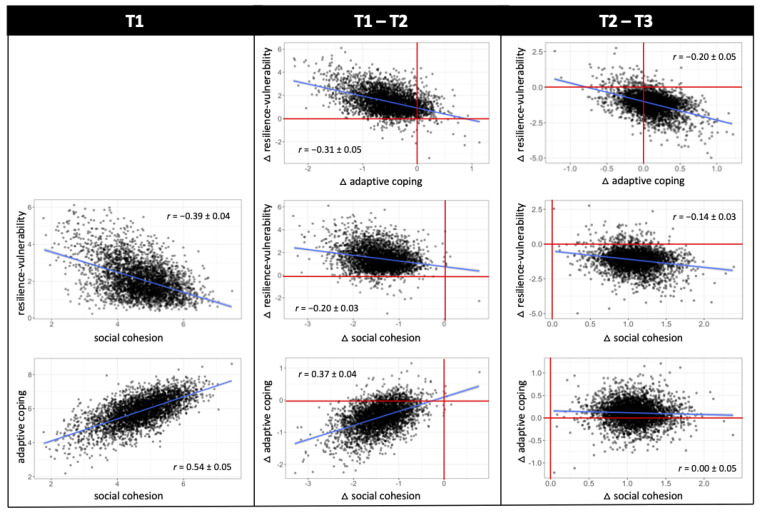
Figure 5.
Scatterplots for the illustration of correlations between resilience-vulnerability, adaptive coping and social cohesion at baseline (T1) and of changes from baseline to the first lockdown (T2) and from lockdown to post-lockdown (T3). Negative change scores indicate a decrease, positive scores indicate an increase. The figure shows no correlation between resilience-vulnerability and adaptive coping at T1, because they are defined as orthogonal.

