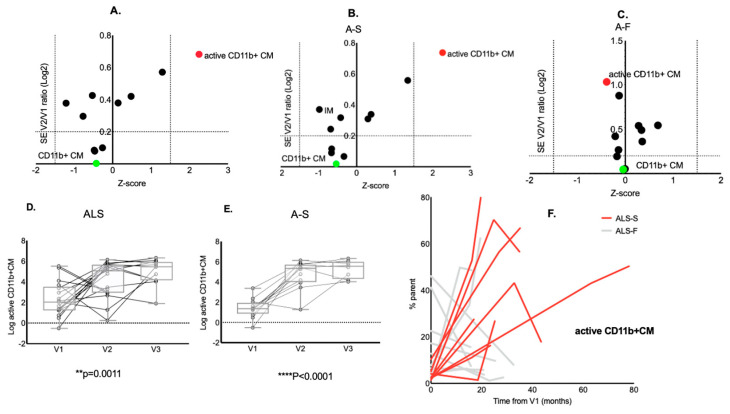
Figure 3.
Changes in monocyte subset frequencies between longitudinal time points. Analysis of stability of expression of monocyte subsets between V2 and baseline (V1) in individuals with ALS and in slow progressing ALS (A-S). Active CD11b+ CM (red dots) are the only monocyte subset to increase over time, showing a significant elevation between baseline and V2 in ALS (A), in A-S (B) but not in A-F (C). In contrast, CD11b+ CM appear stable over time (green dot, A–C). Box plot representation of ANOVA analysis for repeated measures (mixed model with missing values at random) of the changes from V1 to V3 of active CD11b+ CM. In line with the results of the stability analysis, active CD11b+ CM (F) present an up-regulation in the later time points compared to baseline, both for ALS (p = 0.0011) and for A-S (p < 0.0001) (D). Spaghetti plot representing the change over time of active CD11b+ CM between V1 and V3 with a difference in the pattern of expression of A-F compared to A-S (E).

