Figure 1.
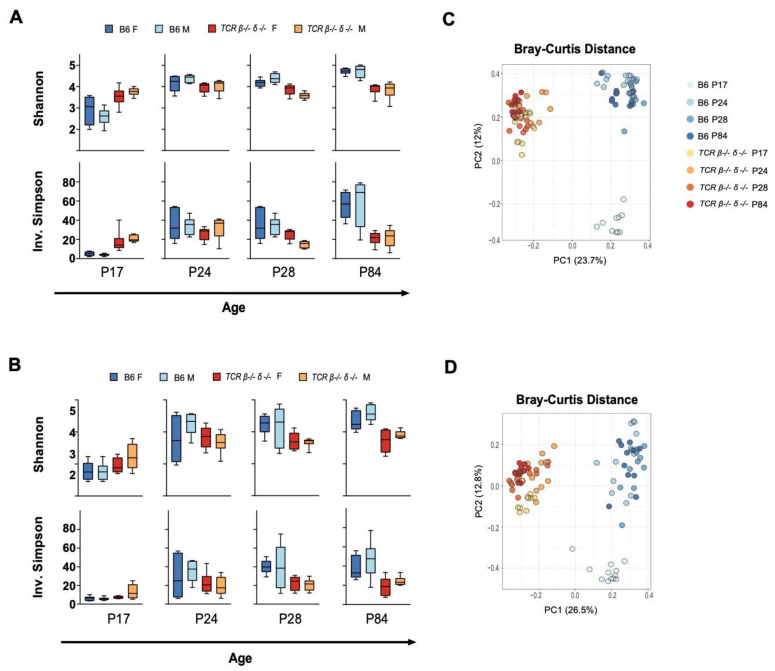
Developmental changes in alpha and beta diversity of cecal and fecal samples in T cell receptor double knock-out (TCR β–/–δ–/–) and C57Bl6 (B6) mice. Shannon and Inverse Simpson indices were used to calculate alpha diversity for each genotype, age and sex (n = 6 per genotype/age/sex). Min-max boxplots comparing alpha diversity metrics across timepoints for cecal and fecal samples are shown in (A,B), respectively. For both cecal and fecal samples, alpha diversity at P17 was higher in TCR β–/–δ–/– than in B6 mice (Shannon fecal p = 0.029, cecal p = 0.0005, Simpson fecal p = 0.029, cecal p < 0.0001). This trend reversed at following timepoints (P24, pre-puberty to 12 weeks, adulthood), with TCR β–/–δ–/– mice exhibiting lower alpha diversity than B6 mice (P24 Shannon fecal p = 0.133, cecal p = 0.038, Simpson fecal p = 0.08, cecal p = 0.39; P28 Shannon fecal p = 0.007, cecal p = 0.0002, Simpson fecal p = 0.007, cecal p = 0.0019; P84 Shannon fecal p = 0.0001, cecal p < 0.0001, Simpson fecal p = 0.0011, cecal p = 0.0002). Sex differences were not observed in alpha diversity. Principal component analysis (PCA) decomposition of Bray-Curtis dissimilarity between samples is shown in (C) (cecal) and (D) (fecal). Samples collected from B6 mice at P17 show strong clustering and separation from later timepoints, a temporal pattern not observed in the microbiota of TCR β–/–δ–/– mice. A significant main effect of genotype was found for both fecal and cecal samples and for all timepoints (p < 0.001).

