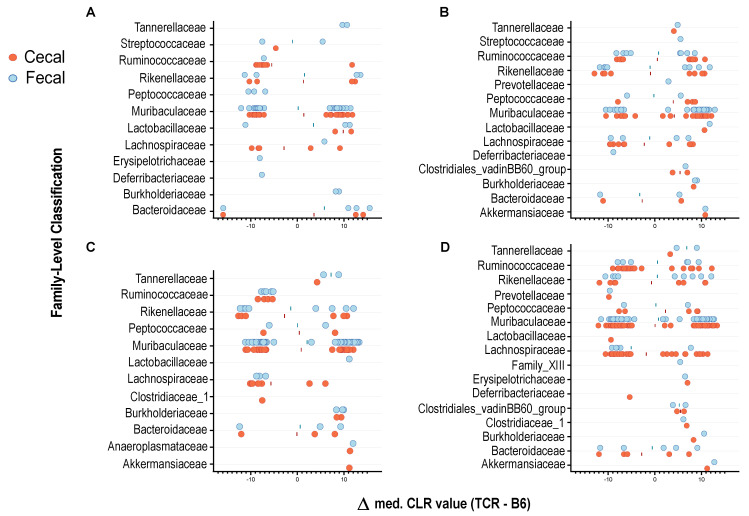
Figure 2.
Differentially abundant taxa between C57Bl/6 (B6) and T cell receptor double knock out (TCR β–/–δ–/–) mice. Individual graphs represent results at (A) P17, (B) P24, (C) P28, and (D) 12 weeks. Each circle represents an individual ASV that was significantly increased or decreased between genotypes, with the median difference in CLR-transformed relative abundance plotted on the X-axis. Positive values represent taxa that are significantly more abundant in TCR β–/–δ–/– mice compared to B6 controls, whereas negative values represent those significantly more abundant in B6 mice.

