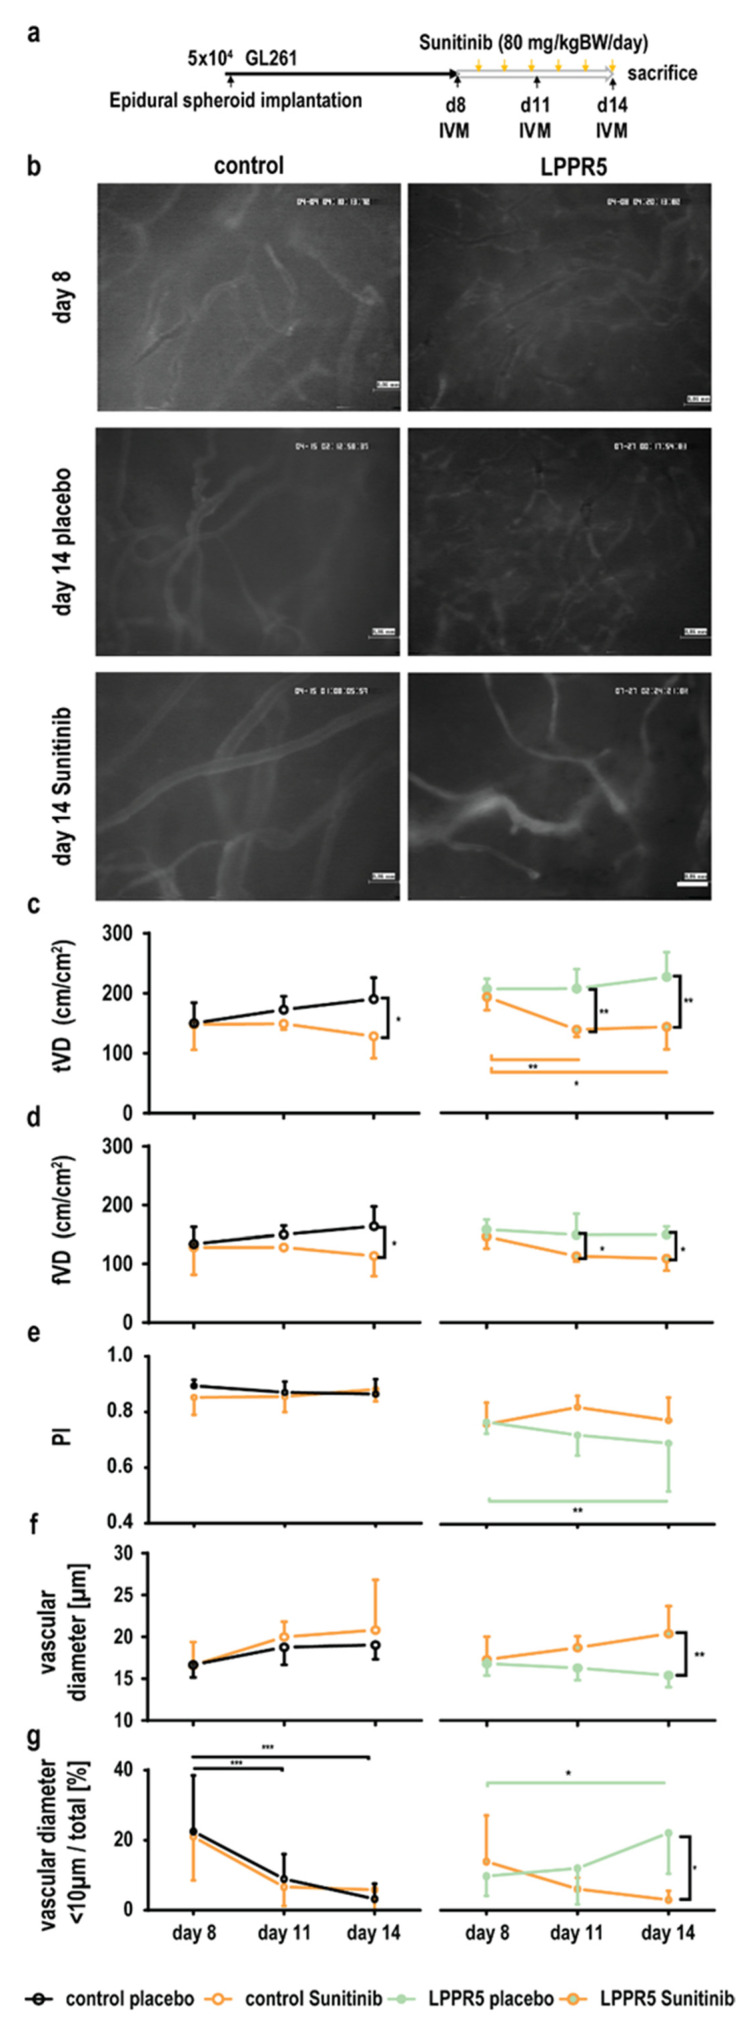
Figure 5.
Intravital fluorescence microscopy visualization of LPPR5OE vasculature. (a) Experimental set-up. (b) Exemplary images of vascular architecture in control and LPPR5OE tumors 8 and 14 days after tumor cell implantation with placebo or sunitinib therapy, respectively (scale bar represents 60 µm). (c) The total vascular density (tVD) quantified in control and LPPR5OE tumors found a significant therapeutic difference in control tumors at 14 days (* p = 0.0108) and a significant difference at 11 (** p = 0.0030, orange bar ** p = 0.0089) and 14 days (** p = 0.0014, orange bar * p = 0.0281) in LPPR5 tumors. (d) Functional vascular density (fVD) quantified in control and LPPR5 tumors showed a significant therapeutic difference in control tumors after 14 days (* p = 0.0300) and a significant difference after 11 (* p = 0.0439) and 14 (* p = 0.0436) days in LPPR5 tumors. (e) Perfusion index (PI, fVD/tVD) showed a significant difference in the LPPR5OE group at 14 days (green bar ** p = 0.0041). (f) Diameter measurements found a reduction in the average diameter in the placebo-treated LPPR5 group compared with the sunitinib-treated LPPR5 at 14 days (** p = 0.0084). (g) The fraction of vessels smaller than 10 µm significantly decreased in the control tumors (11 days: *** p = 0.001; 14 days: *** p = 0.0002). LPPR5OE tumors showed an increase in vessels smaller than 10 µm 14 days after tumor implantation (* p = 0.0194, green bar * p = 0.0190) (c–g): two-way ANAOVA analysis, with Sidak’s multiple comparisons test used for all statistics.

