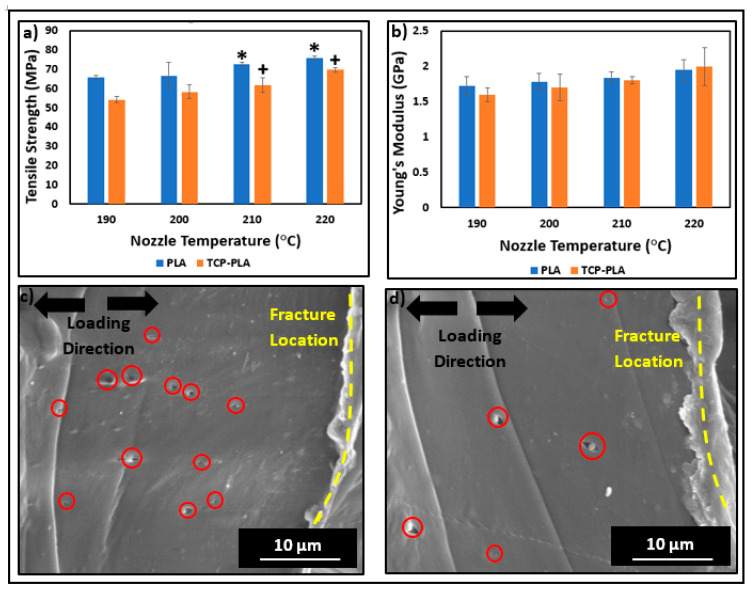
Figure 11.
(a) Tensile strength and (b) Young’s modulus of PLA and TCP–PLA samples printed at different nozzle temperatures. (c) and (d) SEM images of tensile fractured surface morphology of TCP–PLA (Red circles locate the voids generated by TCP particles during tension). (The asterisk (*) and plus symbol are significant with respect to PLA and TCP–PLA samples printed at 190 °C, respectively). (The scale bar represents the actual length).

