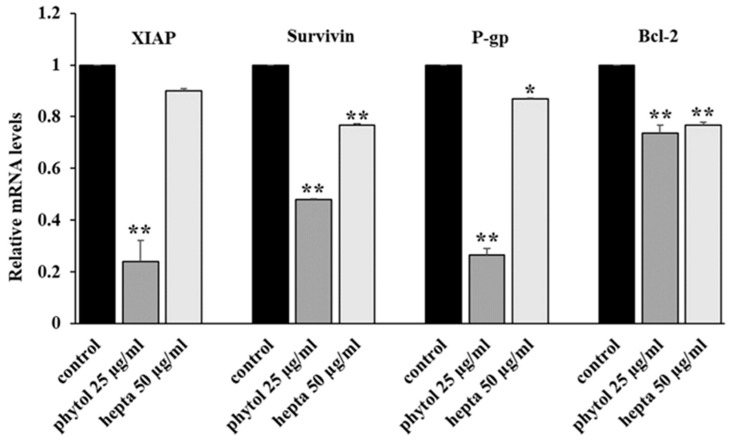
Figure 2.
Genes mRNA expression levels by quantitative polymerase chain reaction in HL-60R cells. The cells were treated for 24 h with phytol (25 μg/mL) or heptacosane (hepta; 50 μg/mL). Data are expressed as mean ± standard error of three experiments. Differences when treatments are compared to the control, ** p < 0.01, * p < 0.05 (one-way ANOVA followed by Tukey’s test).

