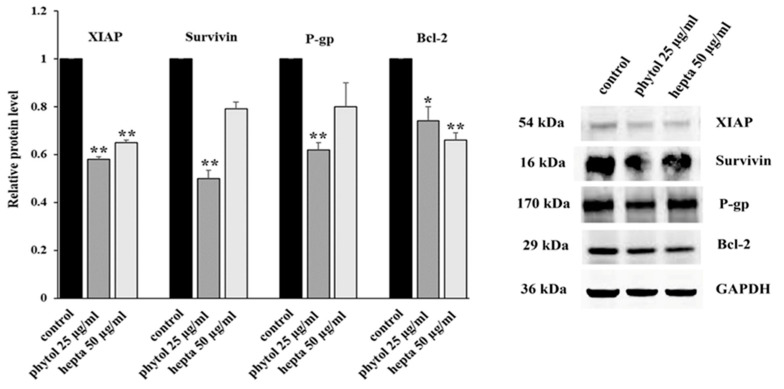
Figure 3.
Western blotting analysis of the levels of XIAP, survivin, P-gp and Bcl-2 in HL-60R cells. The cells were treated for 24 h with phytol (25 μg/mL) or heptacosane (hepta; 50 μg/mL). On the left the results expressed as relative protein level (mean ± standard error of three experiments); differences when treatments are compared to the control, ** p < 0.01, * p < 0.05 (one-way ANOVA followed by Tukey’s test). On the right, the results of a representative experiment. Irrelevant parts of the gel image (such as blank lanes and lanes with molecular weight markers) are deleted. The samples were derived from the same experiment and that gels/blots were processed in parallel.

