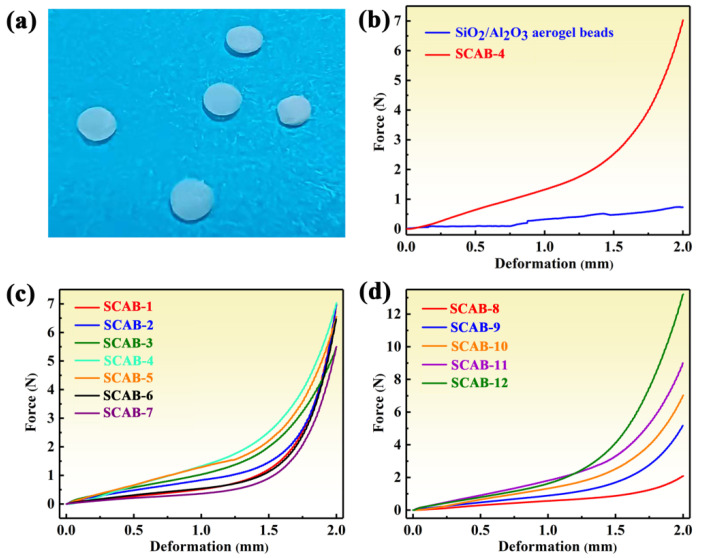
Figure 7.
(a) Photos of SCABs after compression test. Compressive force–deformation curves of (b) native SiO2–Al2O3 aerogel beads and SCAB-4, (c) SCAB 1–7, (d) SCAB 8–12. The shape of the samples is spherical, which causes the cross-sectional areas to change continuously during the compression process, so the x- and y-axes in (b–d) are respectively represented by deformation and force.

