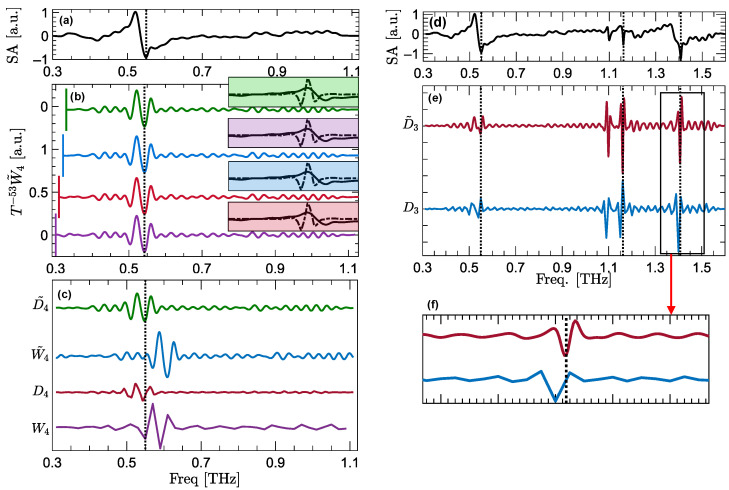
Figure 3.
(a) The SA of -lactose over the frequency range of THz as the control sample. (b) The vertically-offset fourth-level MODWT wavelet coefficients of the SA signal, applied in the frequency domain. Each line in (b) is calculated over a different frequency range, including THz in the purple line, THz in the red line, THz in the blue line, and THz in the green line. The lower bound of the frequency ranges are emphasized using vertical lines at the beginning of each trace. Each inset box, shaded with the same color, shows the overlap between the wavelet filter (dashed line) and the resonant signature (solid line) at 0.53 THz in the corresponding reflection spectra. (c) The vertically-offset fourth-level DWT and MODWT wavelet and details coefficients of the SA signal. Panel (d) shows the SA of -lactose over the entire measurement bandwidth of THz. In (e) are the vertically-offset third-level DWT and MODWT details vectors of the SA signal in (d). Panel (f) zooms into the details coefficients around 1.4 THz, revealing that the DWT details vector (blue line) is slightly misaligned with respect to the resonant frequency, while MODWT details vector (red line) maintains the exact spectral location. The vertical dashed lines in (a–f) delineate the resonances of -lactose.

