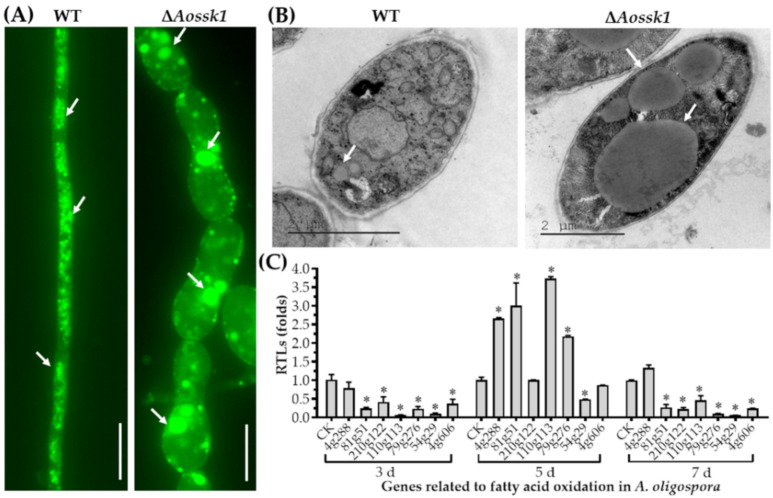
Figure 2.
Comparison of lipid droplets (LDs) and transcription of genes related to fatty acid oxidation between ΔAossk1 mutant and WT strain. (A) Comparison of LDs in the hyphal cells of the WT and ΔAossk1 mutant strains. LDs were stained with 10 µg/mL BODIPY dye. Arrows: LDs. Bar = 10 µm. (B) Observation of LDs using transmission electron microscopy. Arrows: LDs. (C) Comparison of relative transcript levels (RTLs) of genes related to fatty acid oxidation between ΔAossk1 mutant and WT strain on the 3rd, 5th, and 7th days. CK (which has an RTL of 1) was used as a standard for the statistical analysis of the RTLs. An asterisk indicates a significant difference between ΔAossk1 mutant and WT strain (Tukey’s HSD, p < 0.05).

