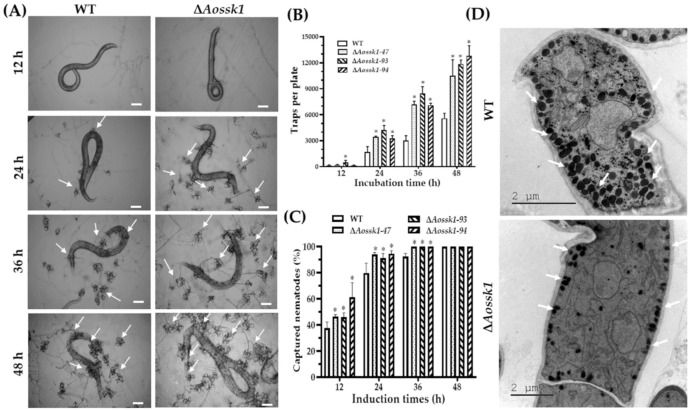
Figure 6.
Comparison of trap formation, nematicidal activity, and electron-dense bodies between WT and ΔAossk1 mutant strains. (A) Trap formation and nematode predation at different time points. White arrows: traps. Bar = 50 μm. (B) Comparison of traps produced by WT and ΔAossk1 mutant strains at 12, 24, 36, and 48 h. (C) Comparison of nematodes captured by WT and ΔAossk1 mutant strains at 12, 24, 36, and 48 h. An asterisk (B,C) indicates a significant difference between the ΔAossk1 mutant strain and the WT strain (Tukey’s HSD, p < 0.05). (D) Observation of electron-dense bodies in trap cells of WT and ΔAossk1 mutant strains by transmission electron microscopy. White arrows: ED bodies.

