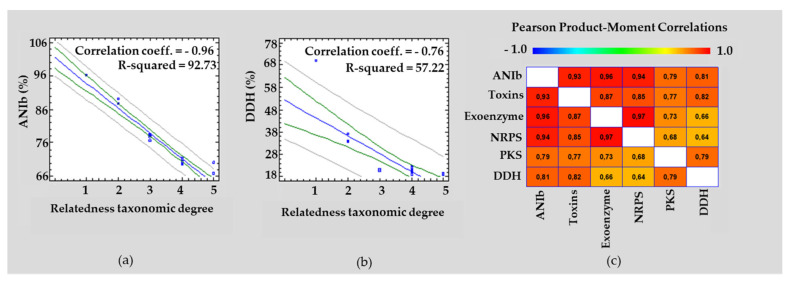
Figure 2.
Correlation analysis of the parameters evaluated in the RGM 2184 and 27 EPF strains. Regression analysis of ANIb (%) (a) and dDDH (%) (b) versus the different degrees of taxonomic relatedness between the RGM 2184 and 27 EPF strains. The values 1, 2, 3, 4, and 5 indicate that the highest degrees of taxonomic relatedness between the RGM 2184 and EPF strains are at the species, genera, family, order, and subfamily levels, respectively. (c) of Person product-moment correlation coefficient graph between the variables ANIb (%), dDDH (%), homologous gene encoding toxins, exoenzymes, PKS, and NRPS. Values of the correlation coefficient close to 1 indicate a highly positive linear relationship (red color). Blue line indicates trendline of data set. Green lines indicate confidence intervals for the mean response at X. Gray lines indicate prediction limits for new observations.

