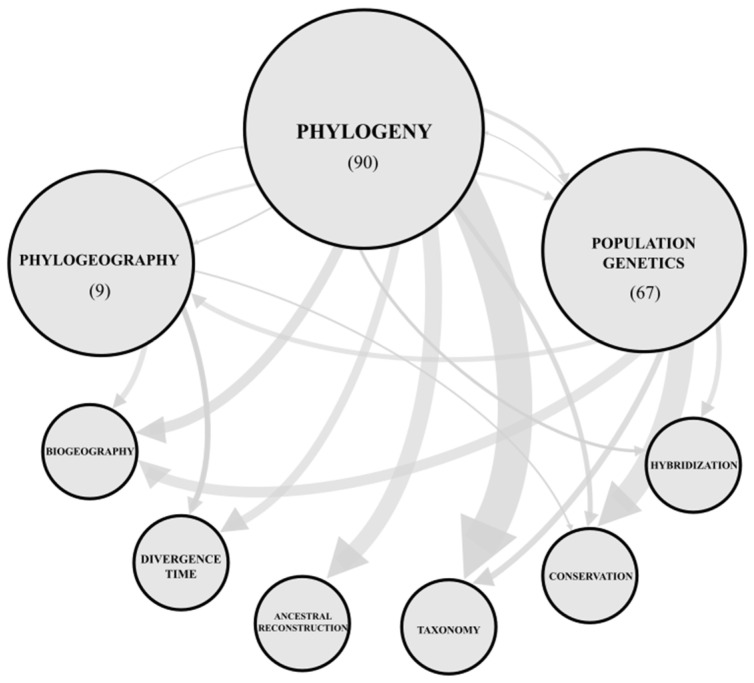
Figure 4.
Network showing connections among the main topics addressed in evolutionary studies of Cactaceae. Circle sizes are proportional to the number of studies in each category (see Table S1), and line thickness is proportional to the number of connections between categories.

