Figure 1.
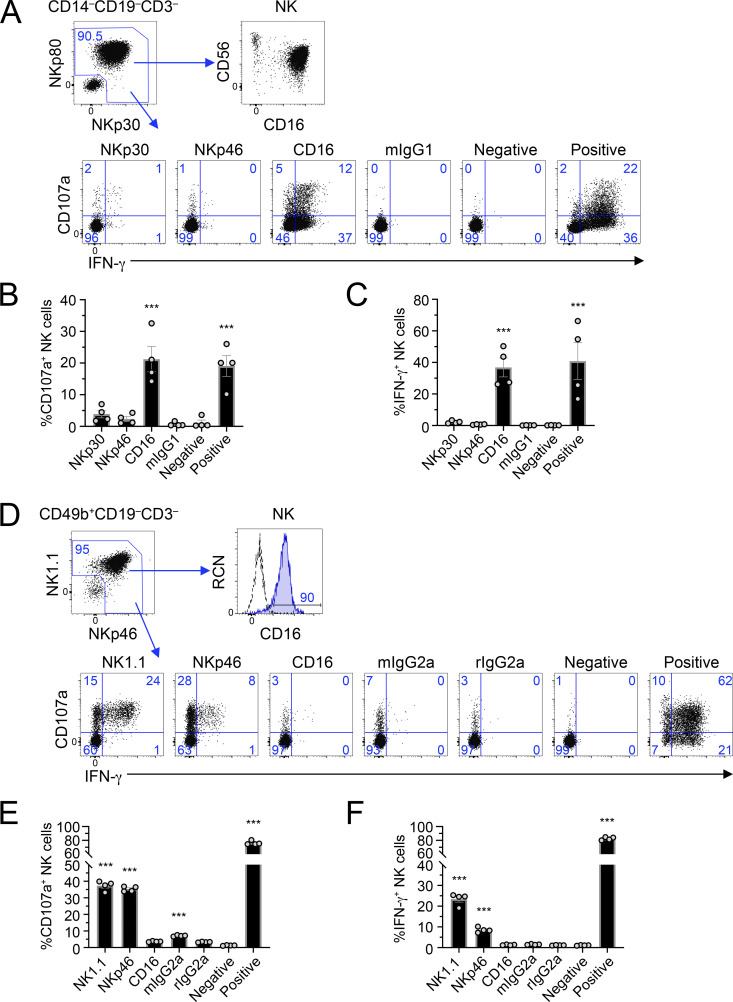
Ex vivo mouse NK cells fail to elicit potent CD16 responses, unlike ex vivo human NK cells. (A–C) Human PBMCs were stimulated by receptor-specific antibodies in plate-bound stimulation assays; 5 h later, they were analyzed by flow cytometry. (A) Gating strategy revealing identification of NK cells, CD16 expression, and representative flow plots of NK cell activation (CD107a and IFN-γ) by different stimuli. Blue numbers in flow plots represent the cell percentage within gates. (B and C) Graphical representation of data in A as measured by percentage CD107a+ NK cells (B) or percentage IFN-γ+ NK cells (C). (D–F) Splenocytes were isolated from C57BL/6 mice and used in plate-bound stimulation assays; 5 h later, they were analyzed by flow cytometry. (D) Gating strategy revealing identification of NK cells, CD16 expression, and representative flow plots of NK activation (CD107a and IFN-γ) by different stimuli. (E and F) Graphical representation of data in D as measured by percentage CD107a+ NK cells (E) or percentage IFN-γ+ NK cells (F). Graphs show mean ± SEM; ***, P < 0.001 represents statistical significance from negative control treatments as determined by one-way ANOVA. All data in A–F are representative of at least two independent experiments with cohorts of four biological samples.

