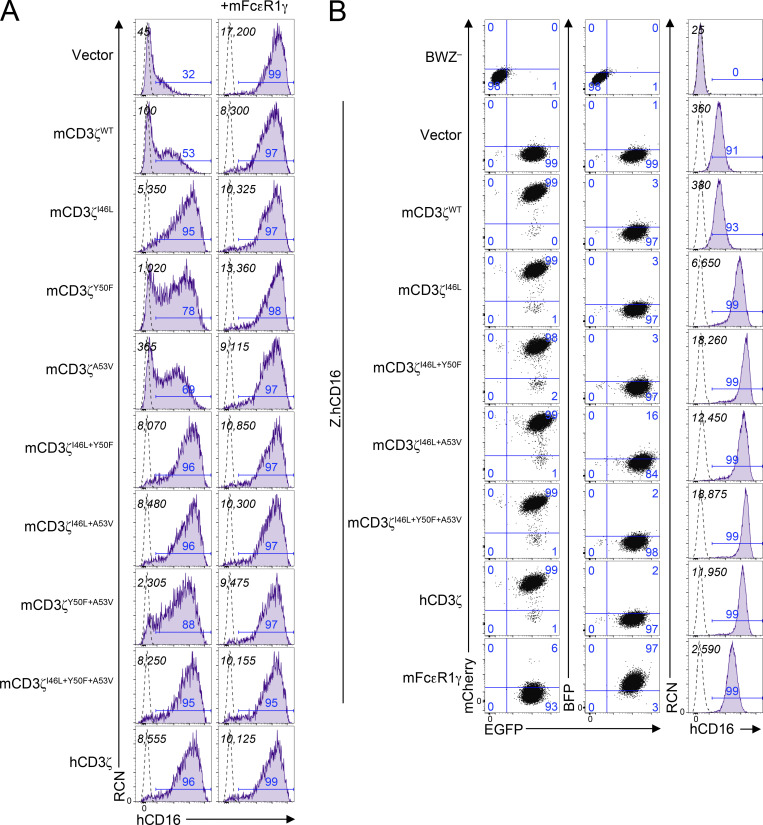
Figure S3.
Analysis of cell surface expression of human CD16 in HEK293T transfectants and BWZ transductants. (A) HEK293T cells were cotransfected with mammalian expression vectors expressing human CD16 in combination with variants of CD3ζ in the absence (left) or presence (right) of mouse FcεR1γ. Italicized numbers in black represent the MFI of CD16; those in blue represent the percentage of CD16+ cells. (B) Expression of human CD16 on BWZ transductants. BWZ− were transduced with retroviral expression vectors expressing hCD16 along with IRES-EGFP as reporter (Z.hCD16), then with vectors expressing either CD3ζ mutants (mCherry+) or mFcεR1γ (BFP+). 2D plots on the left depict the EGFP and mCherry expression (left) or EGFP and BFP expression (center), and the histograms on the right represent the expression of hCD16 on BWZ transductants. Numbers in quadrants correspond to percentage of cells in the gate. Dotted lines represent unstained cells, and shaded purple histograms show cells stained with anti-hCD16 antibody. Black numbers in the top left corner show MFI values of CD16, and numbers in blue above gate represent the percentage of CD16+. Data in A and B are representative of two independent experiments.

