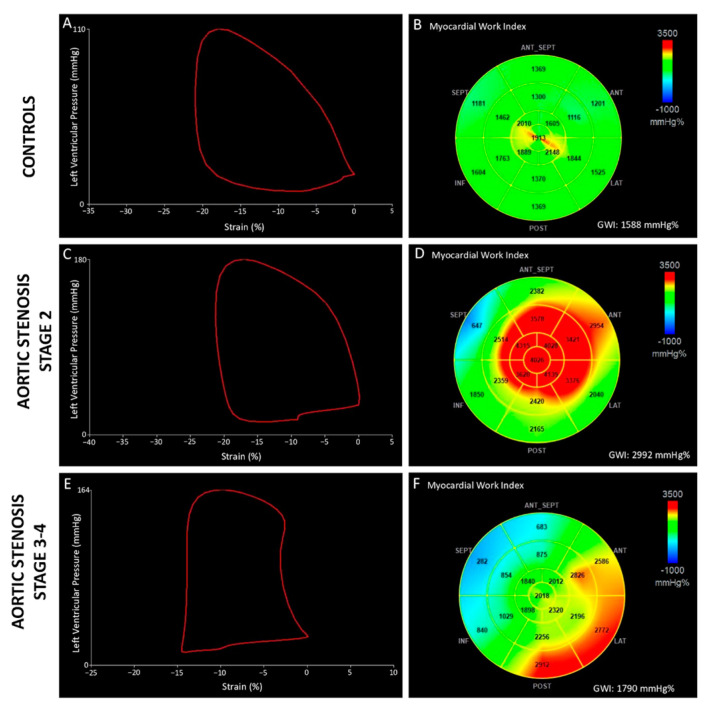
Figure 1.
Pressure-strain loops (left panels) and 17-segment bull’s-eye representation of GWI (right panels) in a healthy subject (A,B) and in two patients with severe aortic stenosis (C–F). Compared to the control patient, aortic stenosis patient in stage 2 of cardiac damage (C,D) presented a larger pressure–strain loop, from which higher value of GWI has been estimated. Conversely, in advanced stage of aortic stenosis (E,F), GWI reduction reflected a more impaired LV contractile performance.

