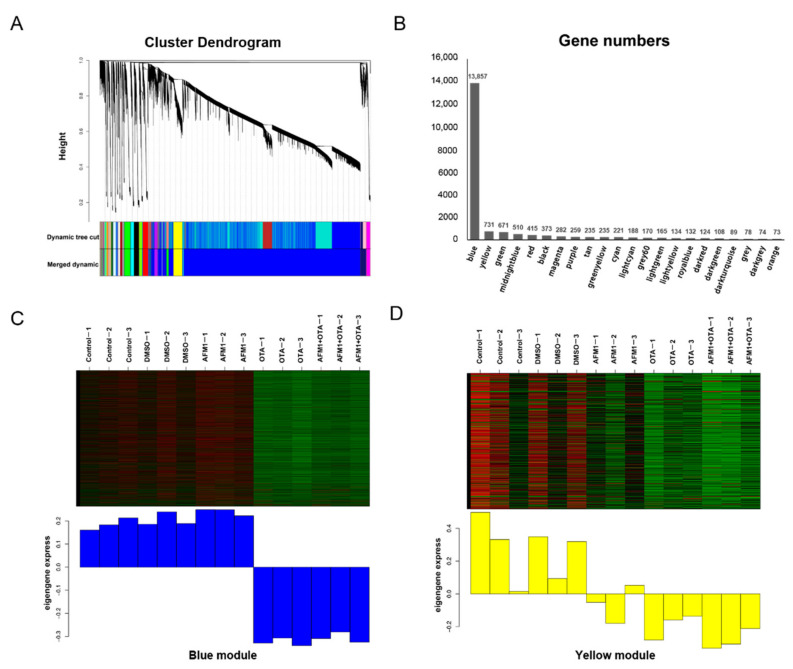
Figure 3.
WGCNA analysis to identify groups of genes. (A) Clustering diagram showing the co-expression modules recognized by WGCNA. Different colors denote different modules. The longitudinal distance indicates the distance between genes, while the horizontal distance is meaningless. (B) The number of genes contained in each module. (C) Heatmap of gene expression pattern of blue module. (D) Heatmap of gene expression pattern of yellow module.

