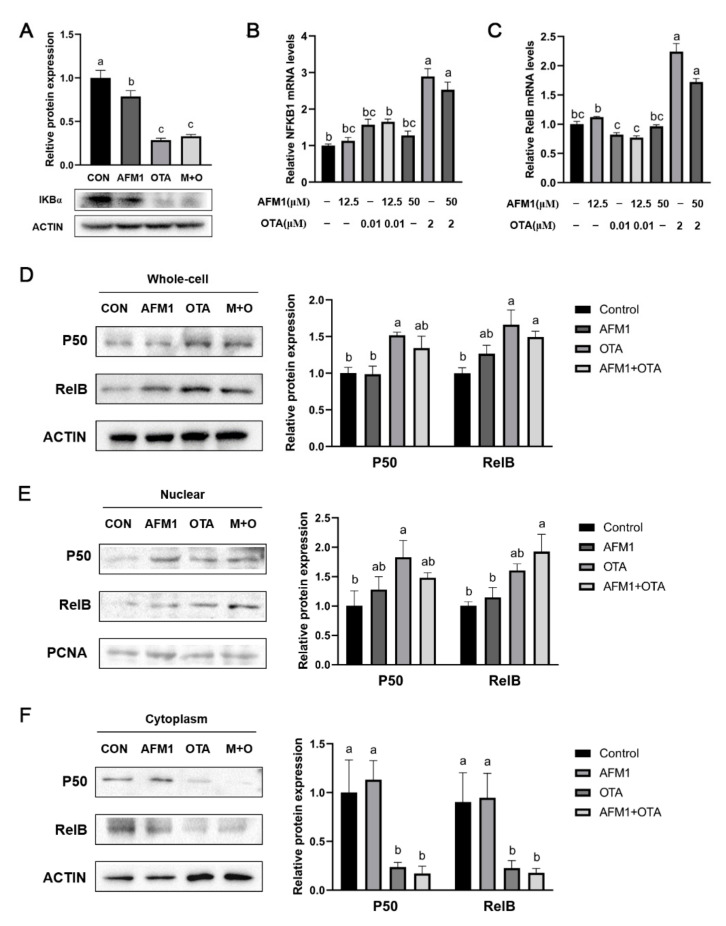
Figure 6.
Effect of single and combined AFM1 and OTA on IκBα degradation and NF-κB activation in FHs 74 Int cells. (A) Relative protein expression levels of IκBα (n = 3). (B) NFKB1, and (C) RelB mRNA expression levels in FHs 74 Int cells detected by RT-qPCR (n = 6). Relative protein expression of p50 and RelB in (D) total protein, (E) nuclear protein, and (F) cytoplasmic protein of cells (n = 3). The bands of IκBα, p50 and RelB were detected by western blotting and quantitated by density analysis tool of Image J software. The data was represented as mean ± SEM. All values in treatment group were compared and normalized to control (set as 1.0). Different lowercase indicates statistical differences between groups (p < 0.05).

