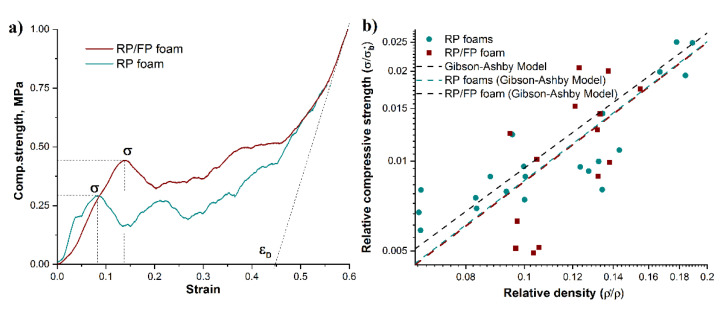
Figure 5.
Compressive stress–strain curves of the RP and RP/FP aluminium foams (a); dependence of relative compressive strength and relative density of the RP (green dots) and RP/FP (red dots) foams; Gibson-Ashby models obtained by fitting experimental results with C and n variables (RP foams—green dash line and RP/FP foams—red dash line) and Gibson-Ashby model with fixed C = 0.3, n = 1.5 (black dash line) (b).

