
Fig. 4. Effect-size on general intelligence of individual genes encompassed in CNVs and their GOterms enrichment.
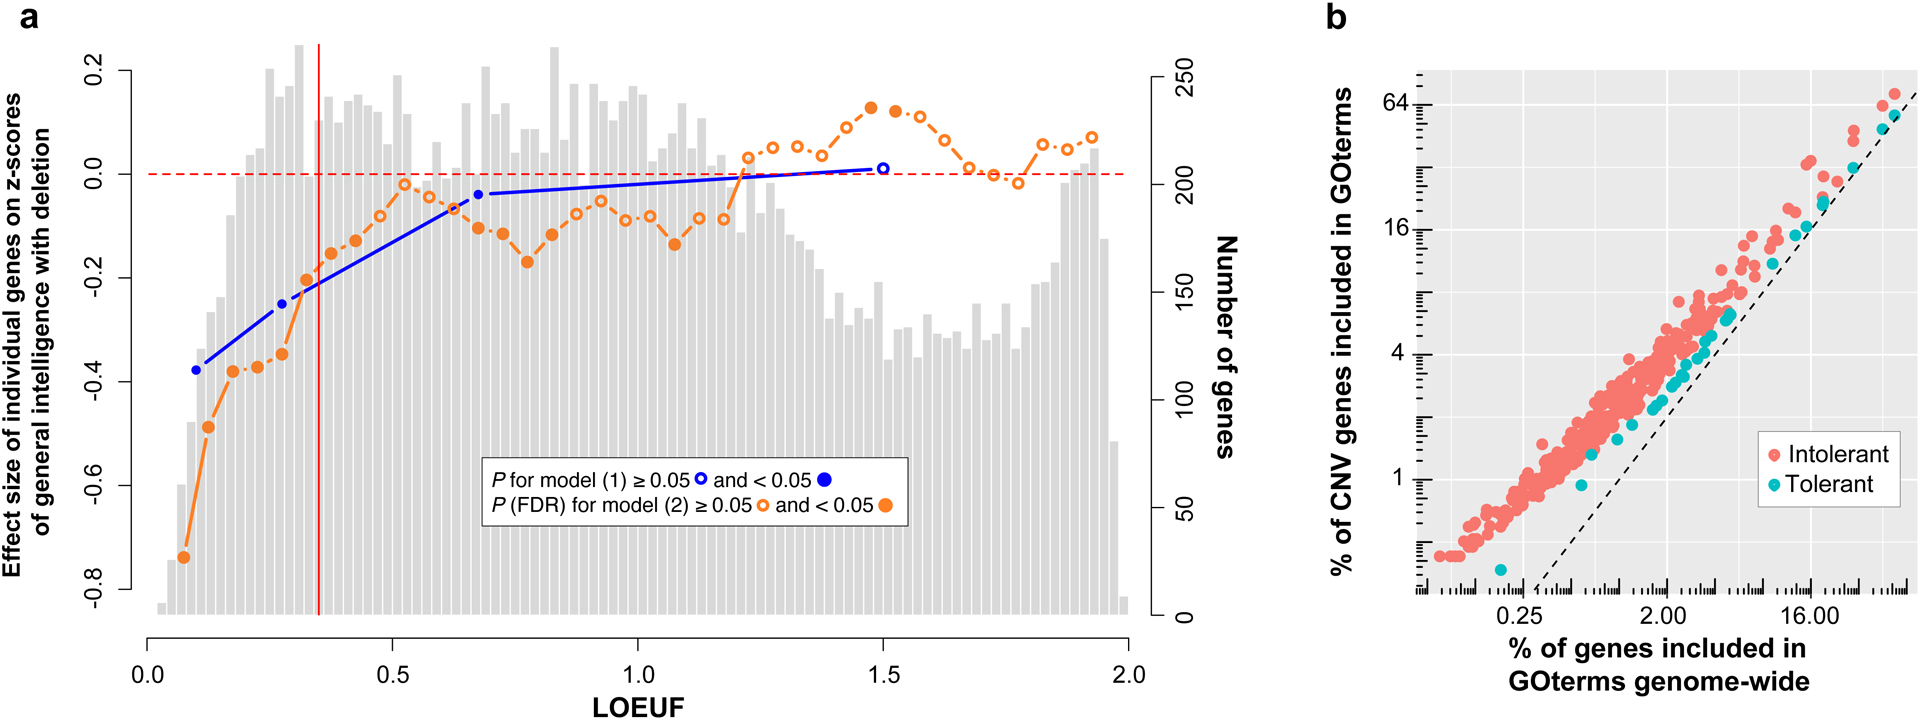
a. , the light grey histogram represents the distribution of LOEUF values for 18,451 autosomal genes. The blue line represents the estimates for a gene in each of the 4 categories of LOEUF included in the model (Supplementary methods): highly intolerant genes (LOEUF <0.2, n=980), moderately intolerant genes (0.2≤LOEUF<0.35 n=1,762), tolerant genes (0.35≤LOEUF<1, n=7,442) and genes highly tolerant to pLoF (LOEUF≥1, n=8,267). The orange line represents the estimated effect-size of 37 categories of genes based on their LOEUF values (sliding windows=0.15) in the model (Supplementary methods). Genes with a LOEUF below 0.35 (vertical red line) are considered to be intolerant to pLoF by gnomAD. Left Y-axis values: z-scored general intelligence (1 z-score is equivalent to 15 points of IQ) for deletion. Right Y-axis values: number of genes represented in the histogram. b. Each point represents a GOterm for which enrichment was observed for intolerant (0<LOEUF<0.35 ; n=609) or tolerant genes (0.35≤LOEUF<1; n=2,251) encompassed in CNVs when compared to all genome-wide intolerant (n=2,742) or tolerant genes (n=7,442) (Bonferroni). X-axis: % of genes included in the GOterm, genome-wide; Y-axis: % of genes encompassed in CNVs included in the GOterm.