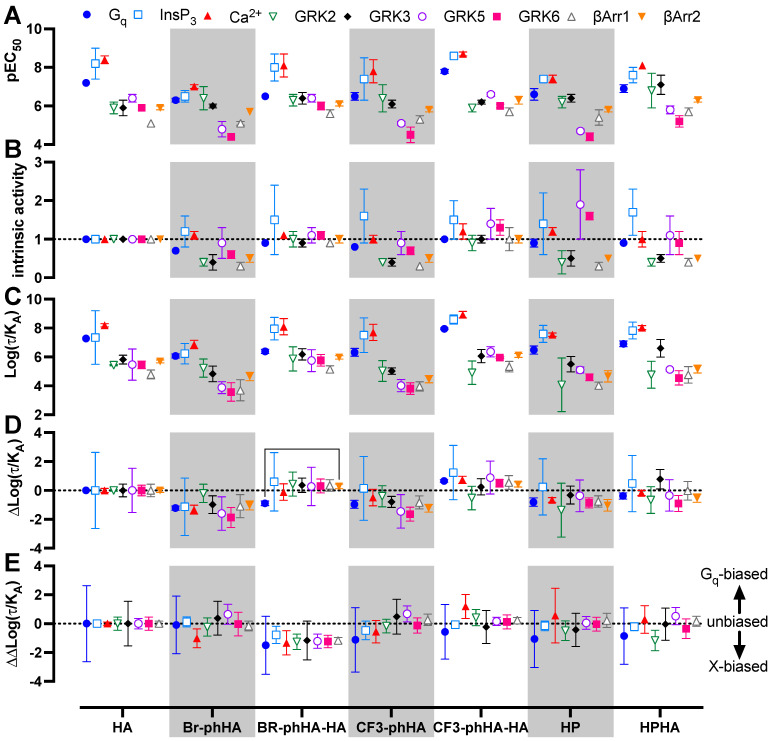
Figure 6.
Biased activities of agonists in BRET-based H1R responses in transfected HEK293T cells. The pEC50 (A) and intrinsic activity (B) values obtained from the concentration response curves in Figure 5 (Supplementary Tables S1 and S2). Intrinsic activities were calculated versus reference full agonist histamine. Transduction ratio (Log(τ/KA) (C), relative effectiveness (ΔLog(τ/KA) (D) and Log bias factor (ΔΔLog(τ/KA) (E) as calculated after analyzing the concentration response curves in Figure 5 using the operational model of agonism to retrieve the transduction ratio (Log(τ/KA; Supplementary Table S3), followed by normalization to the reference full agonist histamine (ΔLog(τ/KA; Supplementary Table S4) and comparison of the various functional readouts to the Gq activation response (ΔΔLog(τ/KA; Supplementary Table S5). Data are shown as mean ± SD from at least three independent experiments performed in triplicate. Statistical differences (p < 0.05) between relative effectiveness of each ligand in the tested responses were determined using Welch ANOVA with Dunnett’s T3 multiple comparison test and are indicated by an asterisk.

