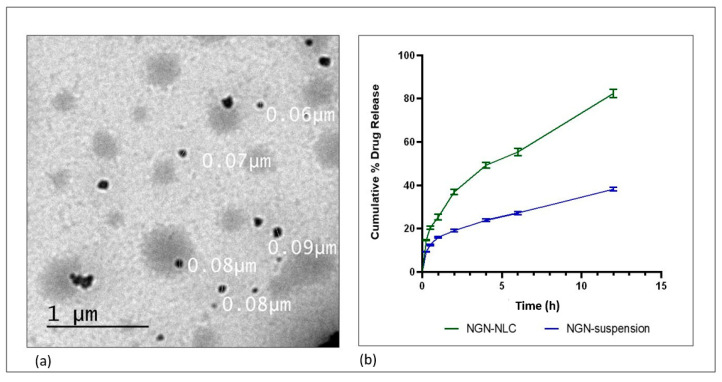
Figure 4.
(a) Surface morphology determination using TEM, showing the uniform distribution of droplets in optimized NGN-NLC. (b) The drug release profile of NGN from NGN-NLC and NGN suspension in phosphate buffer (pH = 6.4) using the dialysis membrane, showed a 2.15-fold increase in drug release from NGN-NLC in comparison to that of NGN suspension. The result was found to be statistically significant, whereas data were expressed using mean ± SD (n = 3).

