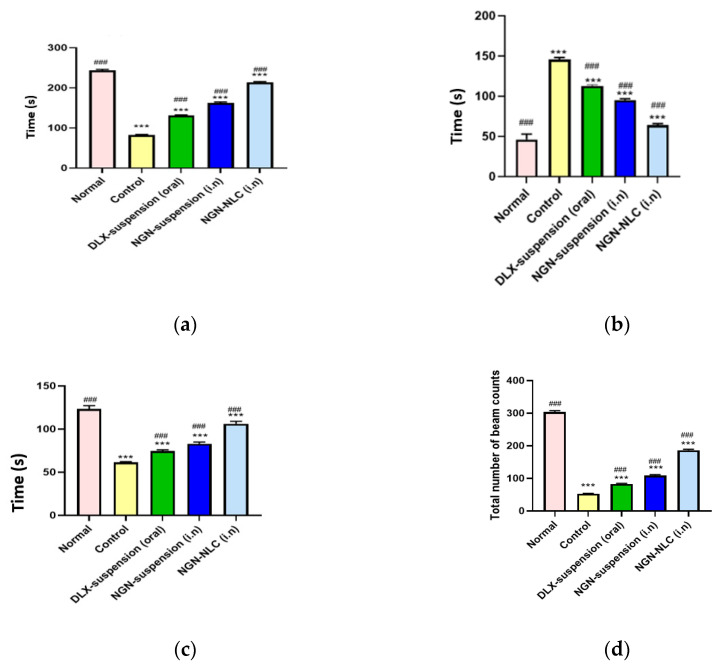
Figure 8.
Pharmacodynamic investigation of different groups after performing behavioral studies such as (a) forced swim test, (b) immobility test, (c) climbing time, and (d) locomotor activity test. (*** indicates that the comparison was made between normal vs. other groups; whereas ### indicates that the comparison was made between control and other groups). Data expressed using mean ± SD (n = 3).

