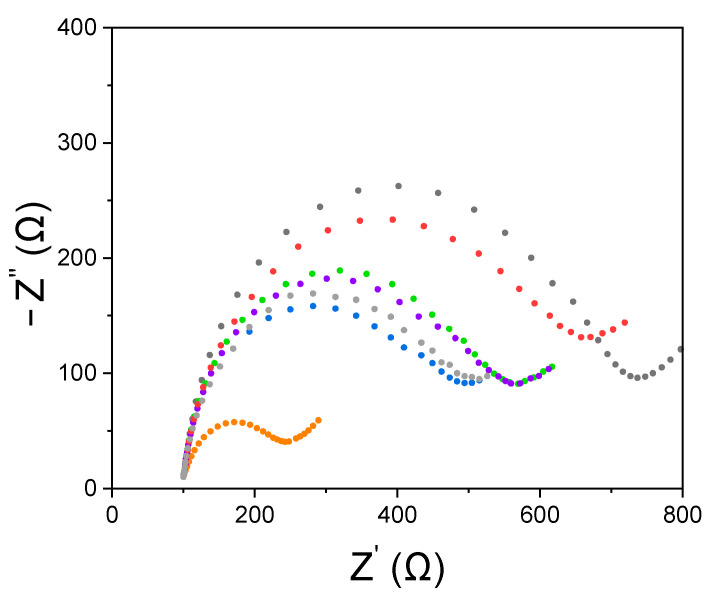
Figure 5.
Nyquist plots recorded on SPCE using the redox probe [Fe(CN)6]4−/[Fe(CN)6]3−2 mM each, KCl 3 mM in PBS: unmodified (black, Rct = 614.44 Ω), modified with electrogenerated AuNPs (orange, Rct = 172.95 Ω), modified with streptavidin (blue, Rct = 384.82 Ω), after 30 min of BSA-sorbitol (grey, Rct = 403.68 Ω) after 30 min of Gli4-T (purple, Rct = 456.59 Ω), after 10 min of biotin (green, Rct = 469.33 Ω) and after 30 min of PWG-Gliadin 0.5 mg L−1 (red, Rct = 586.61 Ω).

