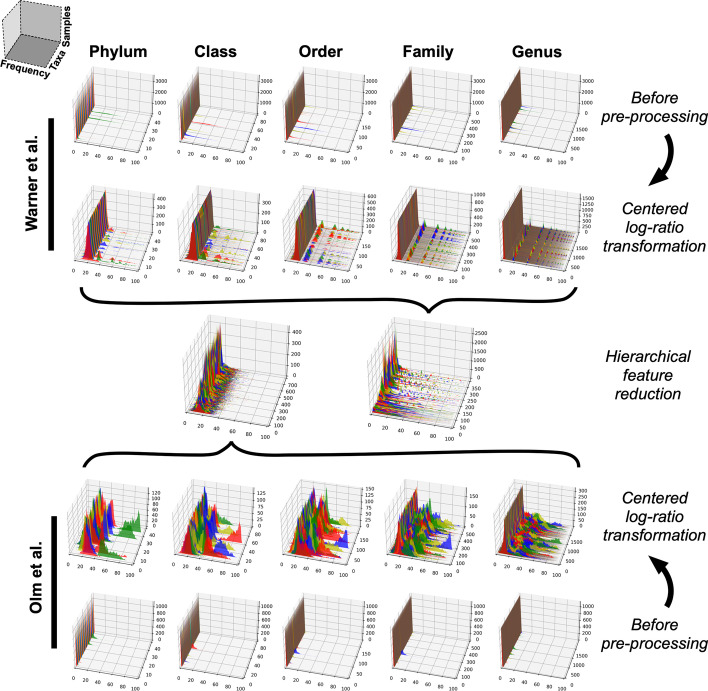
Fig. 2.
Microbiota data pre-processing. Kraken2 bacterial taxa raw counts were processed in two steps before use as input for MIL NEC prediction. Centered log-ratio transformation (step 1) replaces absent taxa with a non-zero value (0.66) and accentuates differences between sparse data collections. This was followed by hierarchical feature reduction to reduce data dimensionality by algorithmically removing uninformative bacterial taxa (step 2). Hierarchical feature reduction involved pruning all branches of the taxonomic tree whose abundance showed Pearson correlation with their parent nodes or which yielded no information gain toward NEC classification. The same processes were applied to both the Warner et al. and the Olm et al. microbiota datasets. For each plot in the figure, the X axis describes a normalized frequency distribution while the Y axis describes the number of patient samples. The Z axis describes the bacterial taxa present at each stage of pre-processing (the total number decreases after step 2; see main text). Peaks are colored with a repeating, alternating pattern for ease of visualization. More abundant taxa are those with higher peaks toward the right side of the plot

