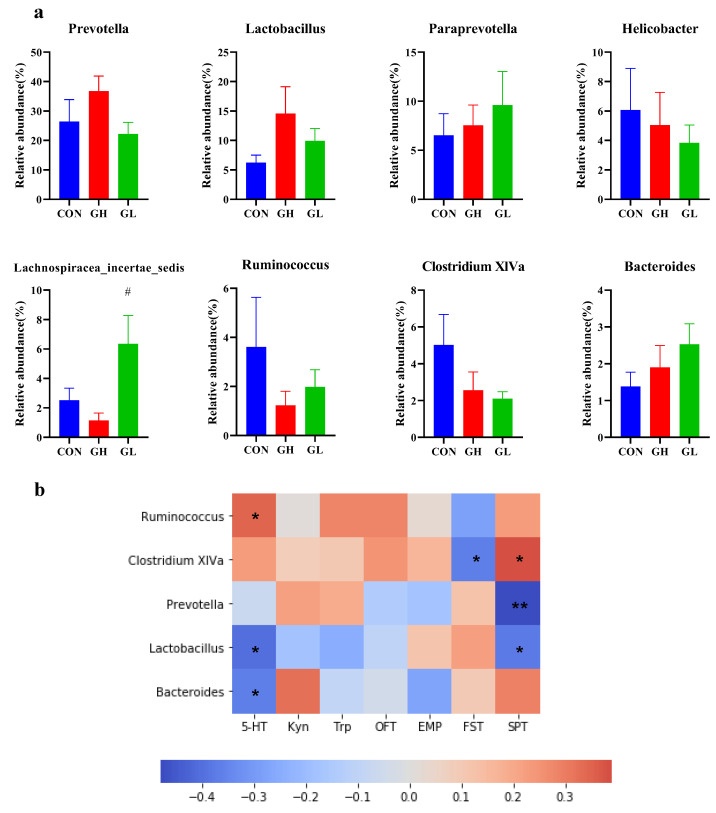
Figure 11.
Difference of relative abundance of gut microbiota at the genus level. (a) The relative abundance of obviously changed genera. (b) The Pearson correlation heatmap focusing on the correlations between microbiota and serum Trp metabolic pathway markers, behavioral test. Scale indicates the level of positive (red) or negative (blue) correlation. * p < 0.05, ** p < 0.01. # significant differences vs. GH group, p < 0.05.

