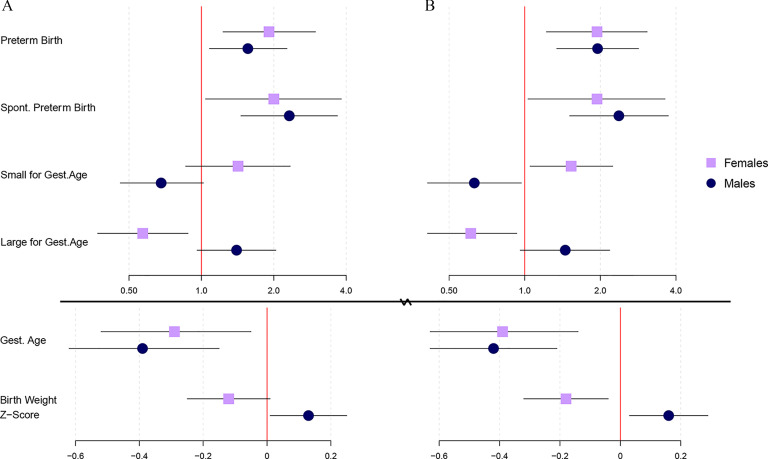
Figure 3.
Associations (points) and 95% CI (bars) from linear/logistic regression between an interquartile range increase in gestational average phthalate ERS derived from (A) adaptive elastic net, or (B) ridge regression, and birth outcomes between male and female fetuses in the PROTECT cohort. Change in gestational age at birth is presented in weeks. Solid vertical lines indicate the null values. All models adjust for maternal age and education, and birth weight models additionally adjust for maternal prepregnancy BMI. Corresponding numeric data can be found in Table S8. Note: BMI, body mass index; CI, confidence interval; ERS, environmental risk scores.

