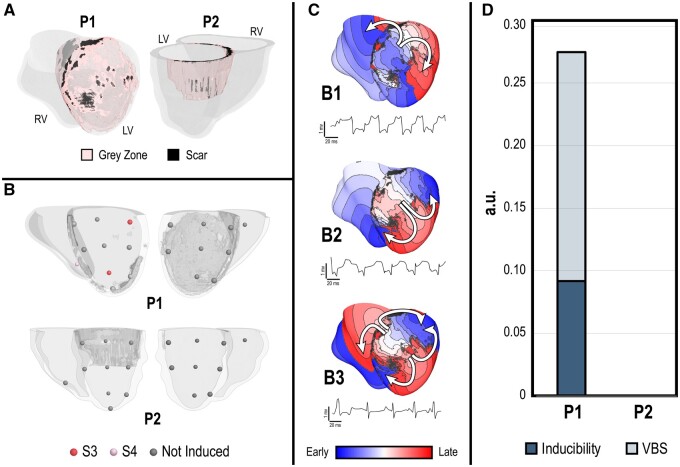
Figure 2.
VT burden in P1 and P2 at baseline prior to simulated remuscularization. (A) Infarct regions (peri-infarct grey zone in pink, scar in black) of P1 and P2 are visualized with semi-transparent non-infarcted regions. Left (LV) and right (RV) ventricle chambers are labelled. While P1 exhibited a large anterior LV infarct that extended into the septum, P2 exhibited a moderate posterior, superior LV infarct. (B) Inducibility maps of P1 (top) and P2 (bottom) indicate the outcome of rapid pacing at each endocardial pacing site (19 total). In P1, VT was induced from three pacing sites, two on S3 (red) and one on S4 (pink). In P2, VT was not induced. (C) Activation maps and pseudo-ECG traces are shown for the three distinct VT morphologies (B1, B2, and B3) induced in P1 at baseline. Activation map colours indicate the sequence of electrical excitation from early (blue) to late (red) for one cycle of re-entry. Pseudo-ECGs show the electrical waveforms for each distinct VT morphology across time. (D) Bar graphs of VT burden in P1 and P2 at baseline; inducibility is overlaid on the VT burden score (VBS). P1 had significant VT burden (VBS = 0.275, inducibility = 0.917, severity = 3), while P2 had none (VBS = inducibility = severity = 0).

