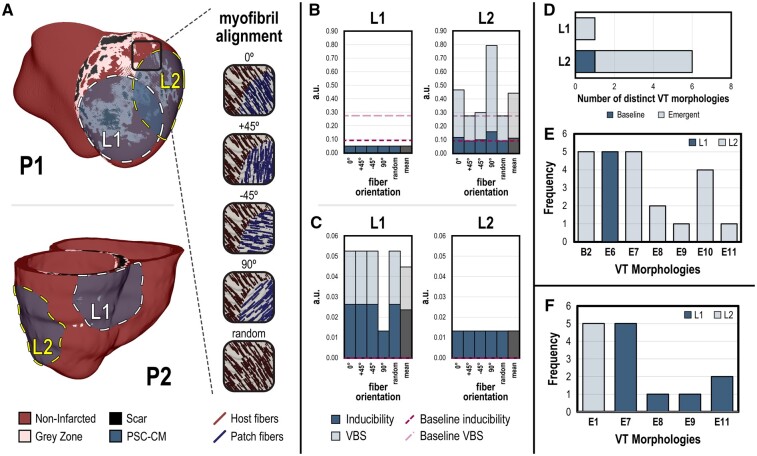
Figure 4.
VT burden is more affected by transplantation location compared with patch myofibril alignment. (A) Complete engraftment of PSC-CM patches (radius = 3.2 cm) was simulated at two different epicardial sites (L1 and L2) in P1 (top) and P2 (bottom). L1 was centrally located over the infarct, while L2 straddled infarct and non-infarcted myocardium. For each site, different myofibril alignments in PSC-CM patches (0°, ±45°, 90°, random) were simulated. Bar graphs show inducibility (dark blue, overlaid) and VT burden (light blue) for each transplantation site, L1 (left) and L2 (right), across all patch myofibril orientations for (B) P1 and (C) P2; mean inducibility and VT burden of all myofibril alignments are shown in grey. Dashed lines indicate inducibility (dark pink) and VT burden (light pink) at baseline. (D) Number of distinct VT morphologies observed in P1 across all myofibril alignments when remuscularization occurred at L1 compared with L2; emergent morphologies are distinguished from ones observed at baseline. (E) All unique VT morphologies and the frequency they were induced in P1. In total, seven different unique morphologies were induced ranging from one previously observed at baseline (B2) to numerous emergent ones (E6, E7, E8, E9, E10, and E11). Complete VT morphology annotations can be found in the Supplementary material online (F) All unique VT morphologies and the frequency they were induced in P2.

