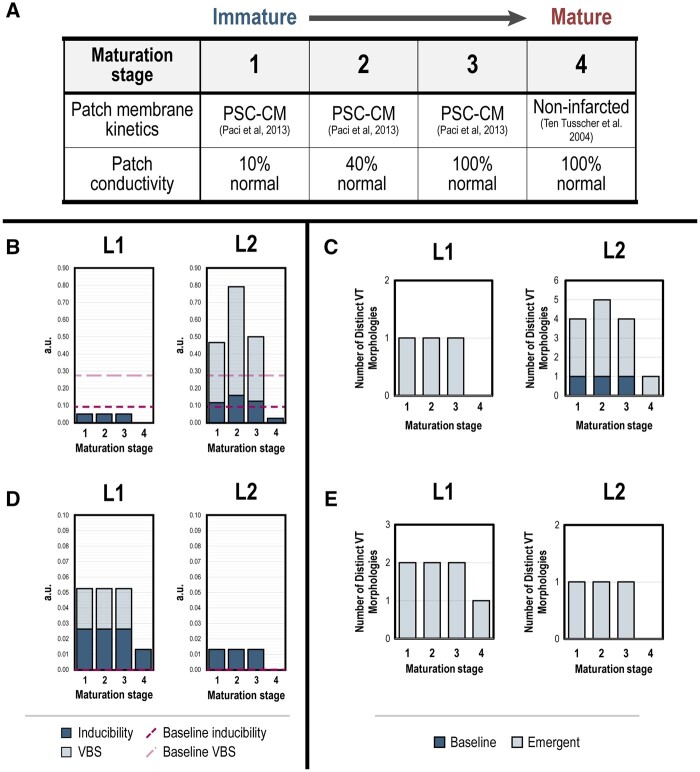
Figure 6.
Changes in VT burden during simulated maturation of PSC-CM patches is specific to transplantation location. (A) Schematic of simulated PSC-CM patch maturation across four stages. In the first three stages, maturation of gap junctional coupling was simulated by increasing PSC-CM patch conductivities from 10% to 40% and 100% of non-infarcted myocardium. In the final maturation stage, membrane kinetics and conductivities in the PSC-CM patch were represented by that of non-infarcted myocardium. (B, D) VT burden across stages of simulated PSC-CM patch maturation in (B) P1 and (D) P2 for remuscularization locations L1 (left) and L2 (right). (C, E) Number of distinct VT morphologies across stages of simulated patch maturation in (D) P1 and (E) P2 for locations L1 (left) and L2 (right).

