Figure 7.
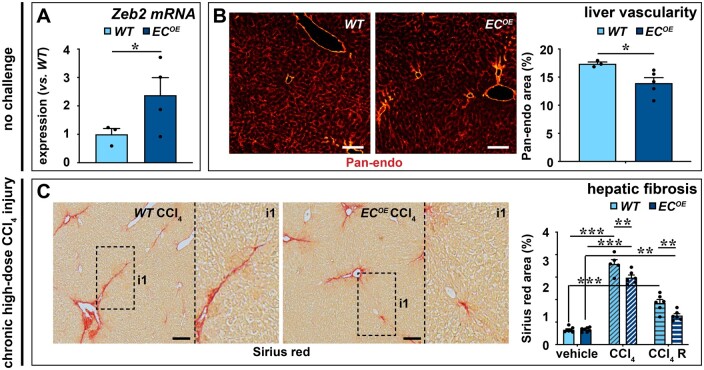
Endothelial Zeb2-overexpression reduces vascular expansion and toxin-induced fibrosis. (A) Expression of Zeb2 in ECs from WT or EC-specific Zeb2 overexpressing (‘ECOE’ mice; n = 5). (B) Pan-endo+ area 4 weeks after the last tamoxifen injection (n = 3–5). (C) Collagen content (Sirius red+ area; n = 5–7) mice 24 h after the last injection of oil or CCl4 (progression cohort) or 1 week after the last CCl4 injection (regression cohort ‘R’). Data are expressed as mean ± sem; *P < 0.05, **P < 0.01, ***P < 0.001 by the Student’s t-test (A and B) or one-way ANOVA with Bonferroni post hoc test (C). Scale bars: 100 µm. EC, endothelial cell; WT, wild-type.

