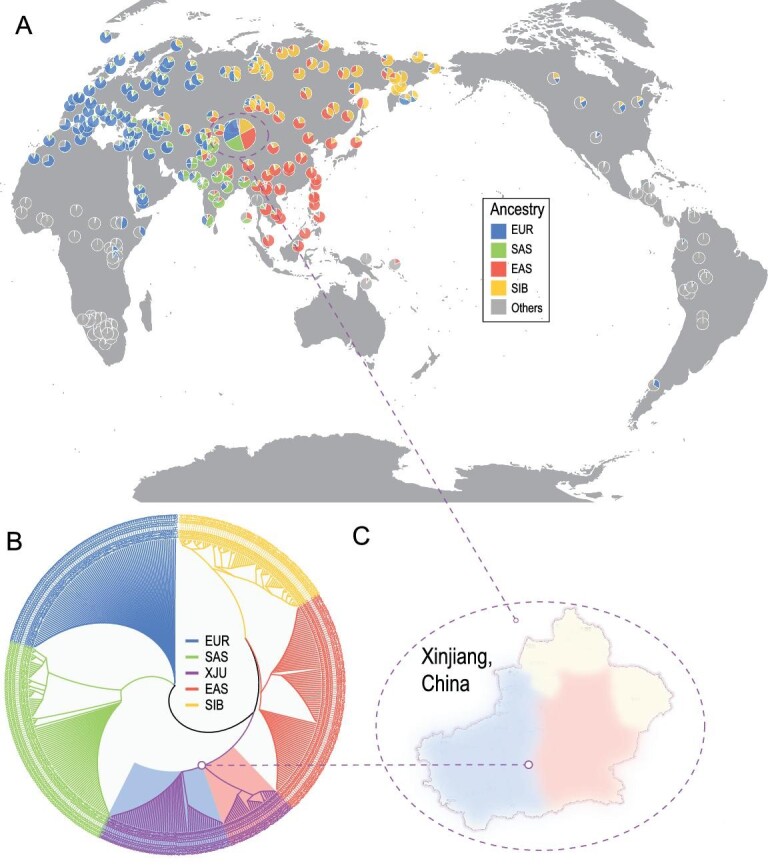
Figure 1.

Ancestry make-up and genetic affinity of XJU. (A) Ancestral proportions of worldwide populations at K = 8. The pie chart for XJU is magnified. (B) Individual trees of XJU, EAS, EUR, SAS and SIB populations. Branch lengths were eliminated for better visualization. (C) Simple geographic identification of the XJU individuals in the two subgroups. Review drawing number: GS(2021)6206.
