Figure 3.
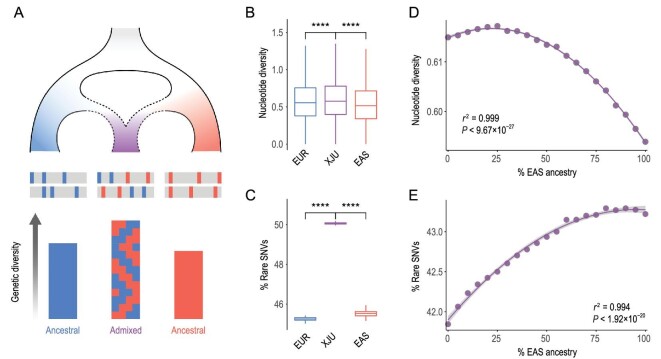
Admixture-driven genetic diversity of XJU. (A) Schematic diagram for admixture-shaped genetic diversity. A combination of genetic components from distinct ancestries results in the higher genetic diversity of an admixed population. (B) Nucleotide diversity (θπ,/Kb) of XJU, EAS and EUR, which was estimated within sliding windows of 50 Kb in length shifted by 25 Kb across the genome. Fifty individuals were randomly sampled to balance the sample size. Statistical significance from the Wilcoxon rank-sum test: ns: P > 0.05; *: P < = 0.05; **: P < = 0.01; ***: P < = 0.001; ****: P < = 0.0001. (C) Rare SNV proportions of XJU, EAS and EUR populations that were estimated as the proportions of SNVs with AF < 0.05. A total of 100 replicates were conducted by random sampling 50 individuals for each association between EAS ancestry and (D) nucleotide diversity as well as (E) rare SNV proportion, which was estimated within sliding windows of 50 Kb in length shifted by 25 Kb across the genome. Median values of nucleotide diversity and rare SNV proportions were used under different ancestry proportions. The curves were fitted using the function ‘lm’ in R.

